🌍 Public
vedasri-ICE8-Social Network Graph
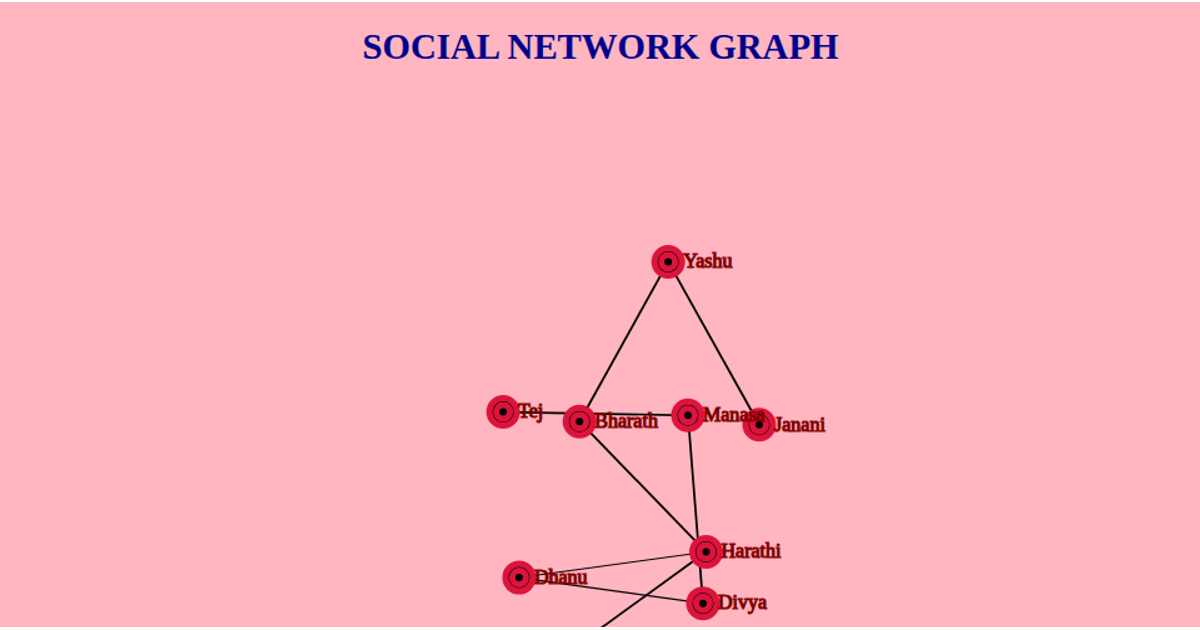
This interactive social network graph shows a central node representing the state of Andhra Pradesh connected to a cluster of district nodes. The visualization uses D3.js force-directed simulation (`d3.forceSimulation`, `d3.forceLink`, `d3.forceManyBody`) to position nodes and links, with draggable circles and labels. Data is fetched from a remote CSV file and parsed using `d3.csvParse`, then mapped to nodes and edges before rendering as SVG with tooltips.
AI-generated descriptionMIT Licensed




Comments
Sign in to join the discussion.