🌍 Public
Fork of Social Network Graph --> ICE-8
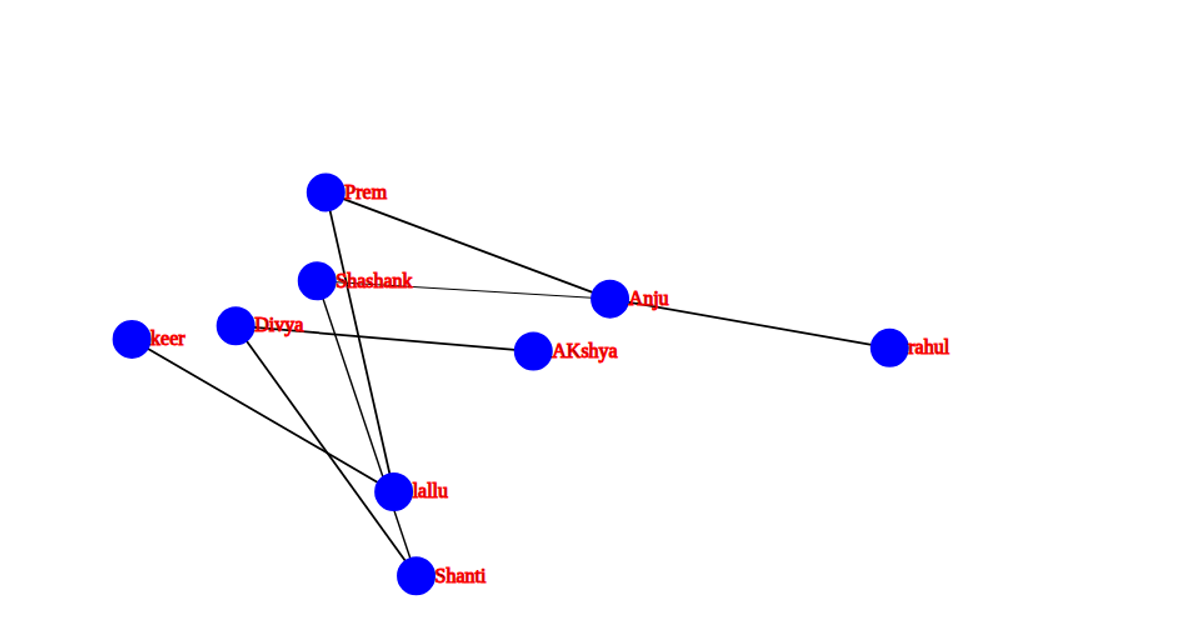
This example shows a social network graph of Andhra Pradesh districts, with the state as a central red node and each district as a smaller blue node, connected by gray links. The visualization uses D3.js v7’s `d3.forceSimulation`, `forceLink`, `forceManyBody`, and `forceCenter` to position nodes and links, while `d3.drag` enables interactive dragging. Data is fetched from a remote CSV and parsed with `d3.csvParse`. Node labels and hover tooltips are rendered in SVG, with the entire graph replacing the initial SVG element.
AI-generated descriptionMIT Licensed




Comments
Sign in to join the discussion.