🌍 Public
Fork of Missing Migrants Date Histogram
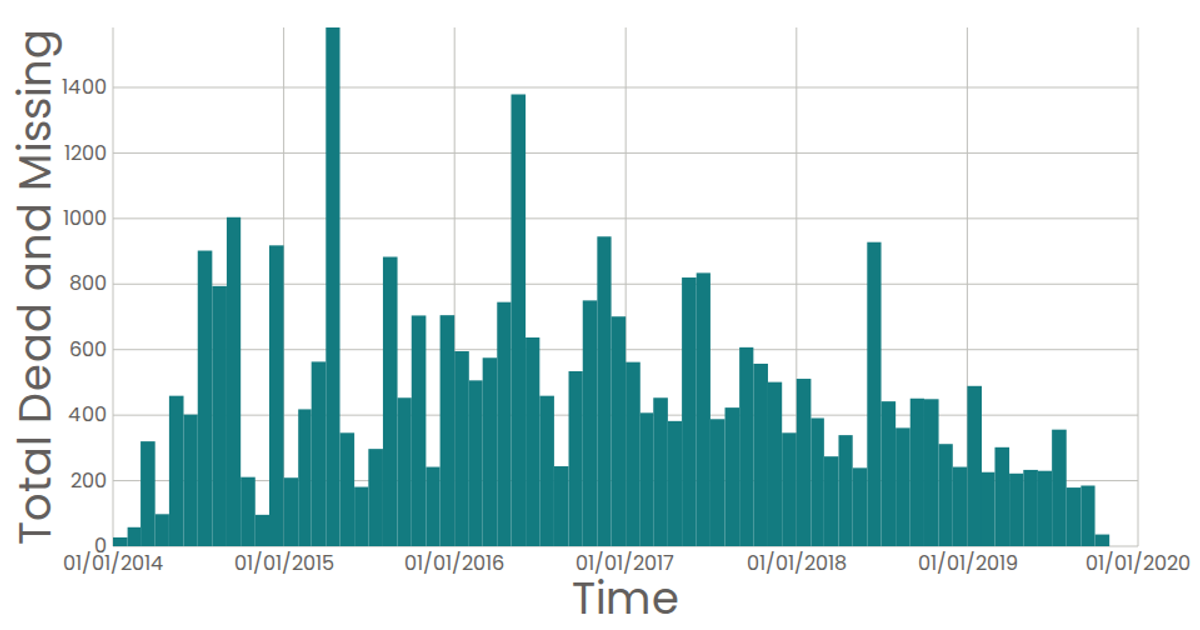
A date histogram visualizes the monthly sum of dead and missing migrants from the Missing Migrants Dataset, using time-binned bars along a linear scale for counts. Built with React and D3 v5, the chart applies `d3.bin` with `timeMonths` thresholds and `d3.sum` to aggregate values, rendering SVG rectangles via reusable axis and mark components. Axes are drawn with custom `AxisBottom` and `AxisLeft` components, while a native SVG `<title>` element provides hover tooltips showing the total per bin.
AI-generated descriptionA date histogram showing the sum total dead and missing migrants for each month.
Data from the Missing Migrants Dataset.
MIT Licensed




Comments
Sign in to join the discussion.