Fork of AI Research Project (initial backup)
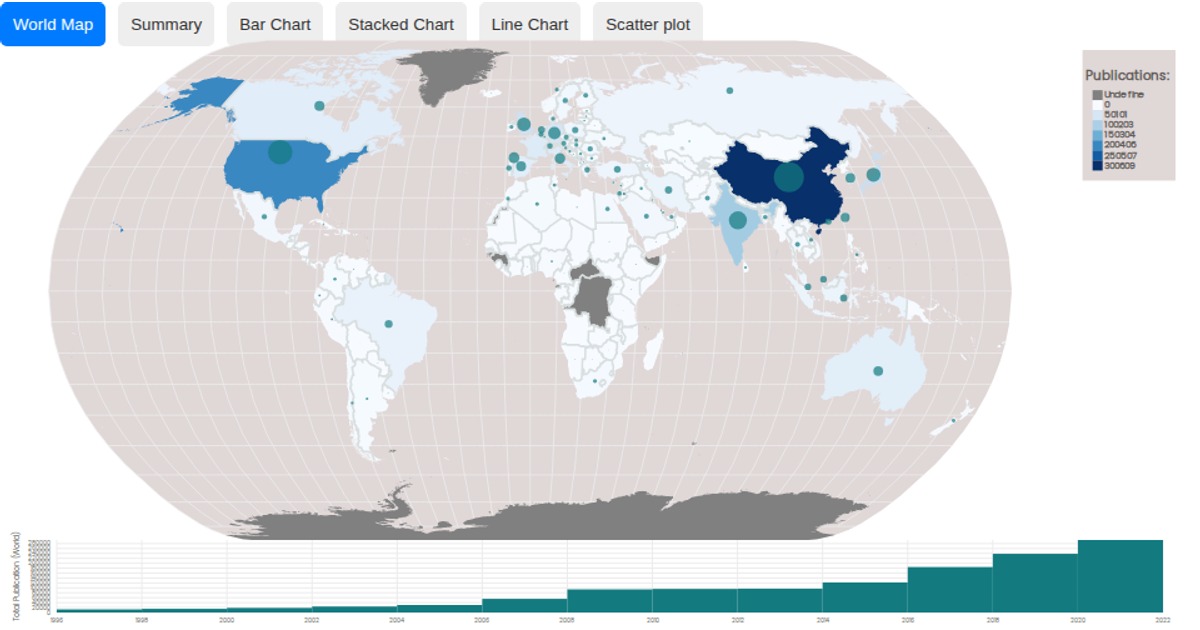
This interactive visualization combines a choropleth map with a linked time-series histogram to explore global AI research publications from 1996 to 2022. The map colors countries by publication totals using a sequential blue scale, with bubble sizes reflecting aggregated output for a selected year range. Users can brush the time-series chart to filter the map, dynamically recomputing summed data across years. Built with React and D3 v5, the example uses `geoNaturalEarth1` and `geoPath` for map projections, `scaleSequential` with `interpolateBlues` for coloring, and `brushX` for interactive selection, with data sourced from a CSV and world-atlas TopoJSON.
AI-generated descriptionA world map showing cities with population greater than 50,000. City data from Simplemaps: World Cities Database.
Country boundaries from World Atlas TopoJSON, polished for visual style, including graticules.
This iteration is optimized for performance using React's useMemo hook.





Comments
Sign in to join the discussion.