🌍 Public
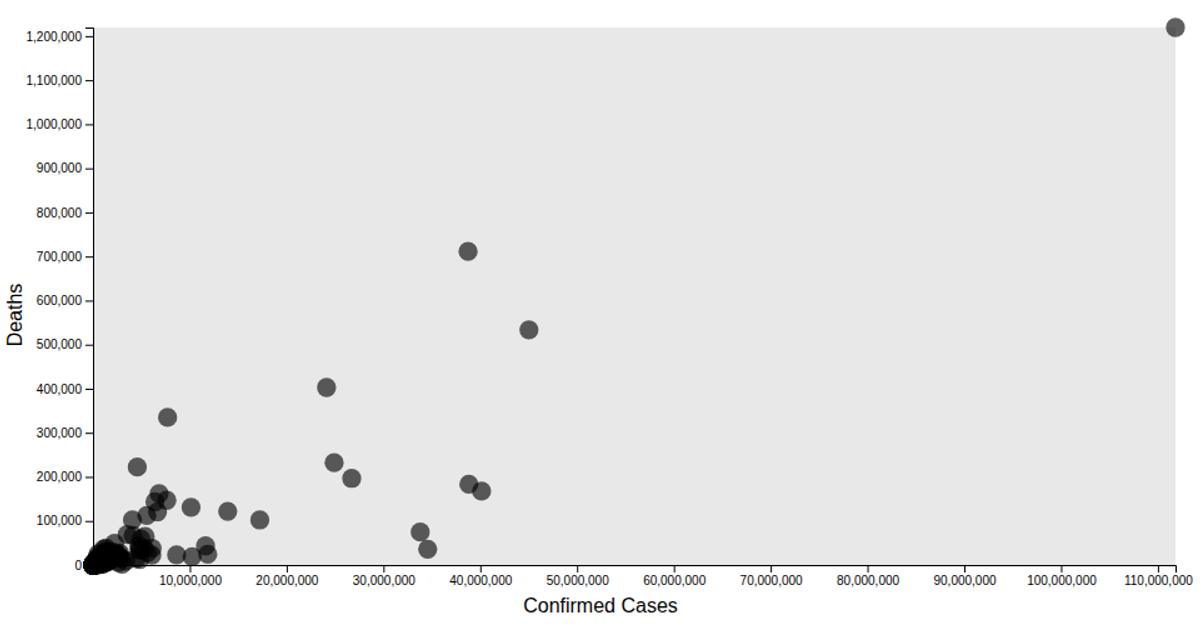
Scatter Plot Of Comfirmation
This scatter plot visualizes the daily count of confirmed cases over time, with each circle representing a data point from the loaded CSV file. The y-axis is labeled "SuspectedCount," while the title refers to "SuspectedCount," suggesting a possible mislabeling. The visualization uses d3.scaleTime and d3.scaleLinear for axis scaling, d3.extent for domain calculation, and renders circles via SVG appended by d3.select and selection.enter. Axis labels and titles are added via d3.axisLeft and d3.axisBottom, with the code also defining a d3.line generator (commented out) for a potential trend line.
AI-generated descriptionMIT Licensed




Comments
Sign in to join the discussion.