Simple Scatter Plot
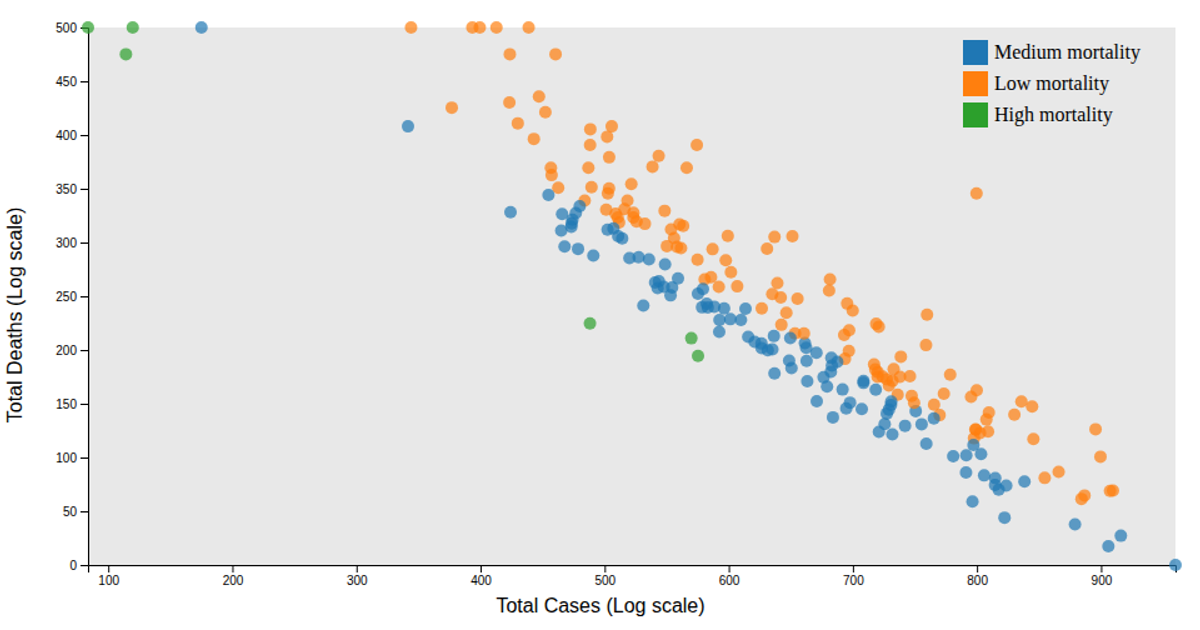
This simple scatter plot visualizes COVID-19 data, mapping confirmed cases on the x-axis against deaths on the y-axis for each country. Each circle represents a country, with the plot revealing a strong positive correlation and one prominent outlier with over 110 million confirmed cases. The visualization uses D3's `scaleLinear`, `axisLeft`, and `extent` functions to create the scales and axes, while circles are rendered with SVG elements. The code leverages `@curran/axis-labels` for axis labeling, reading from a static CSV dataset.
AI-generated descriptionA simple scatter plot with D3 showing the confirmed cases versus number of deaths per country
Note that there is 1 very large outlier, with over 110,000,000 confirmed cases and 1,200,000 Deaths
One thing I would be curious about is hovering over the circle to show the country name or code as a sort of popup, to more easily tell what country is where on the scatterplot






Comments
Sign in to join the discussion.