Amazon Finances
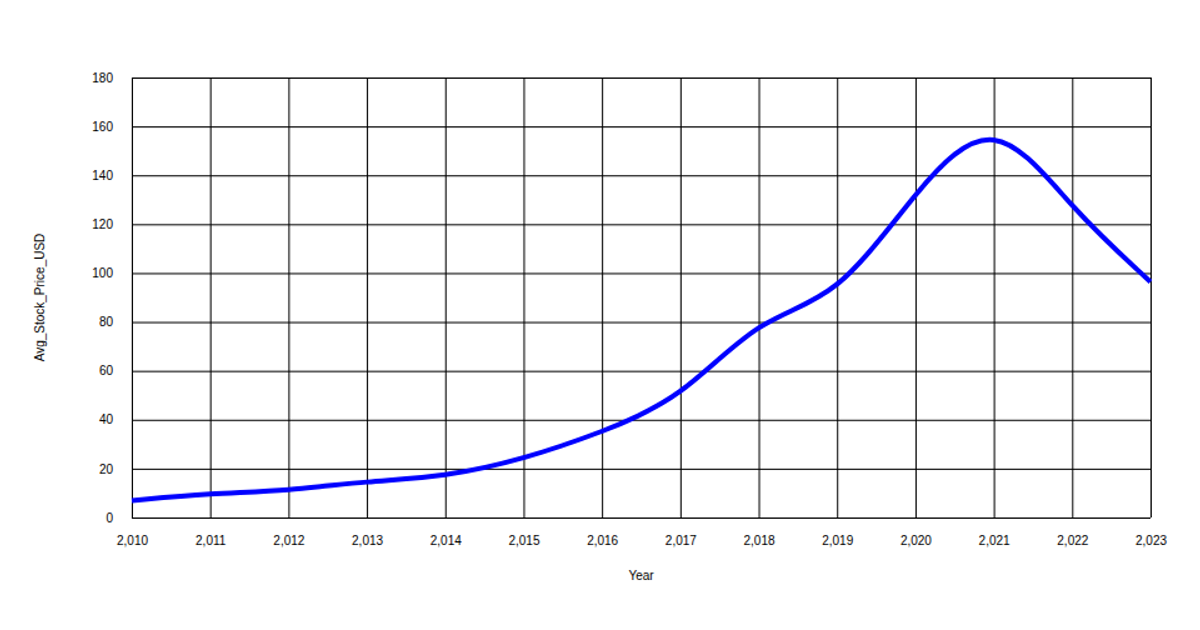
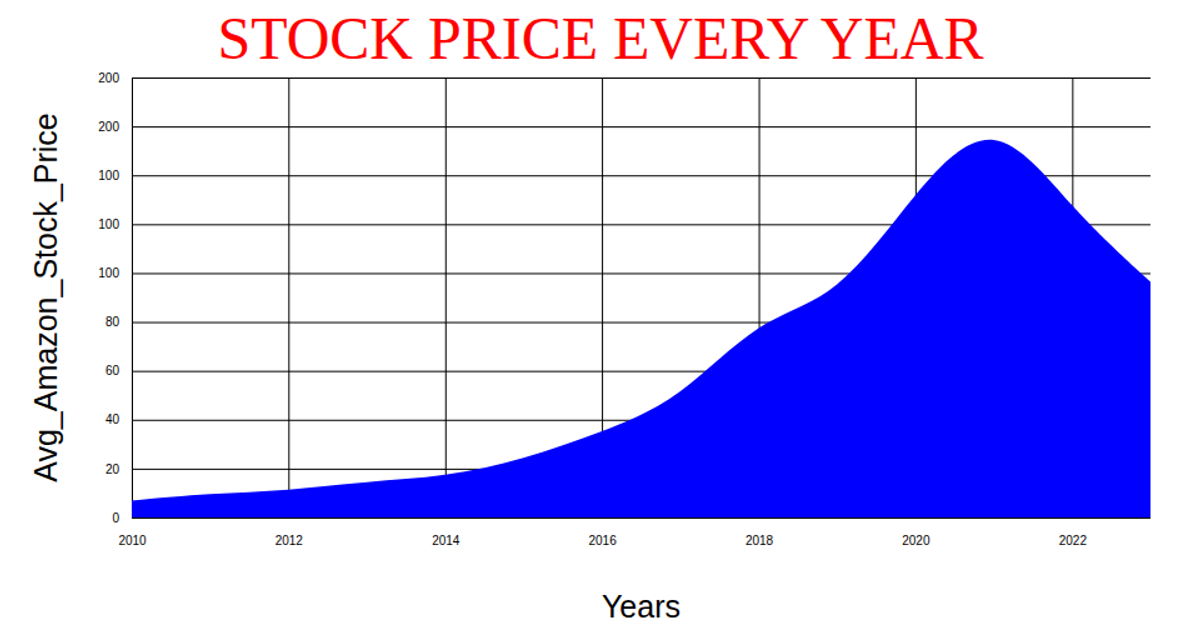
This visualization compares Amazon's financial metrics between 2023 and 2024, displaying revenue, net income, operating income, AWS revenue, and advertising revenue as bar charts. Users select a metric via an interactive pill-shaped selector at the bottom. The React app uses D3 v7's `scaleBand`, `scaleLinear`, and `axisBottom`/`axisLeft` to render the axes and bars. Data is loaded from a CSV via D3's `csv` function, showing values in billions of USD with year-over-year comparisons.
AI-generated descriptionAmazon Financial Performance Visualization
This visualization compares Amazon's financial metrics between 2023 and 2024, including:
- Revenue
- Net Income
- Operating Income
- AWS Revenue
- Advertising Revenue
Users can switch between different financial metrics using the selector at the bottom of the visualization.
The chart displays the values in billions of USD and shows year-over-year changes.





Comments
Sign in to join the discussion.