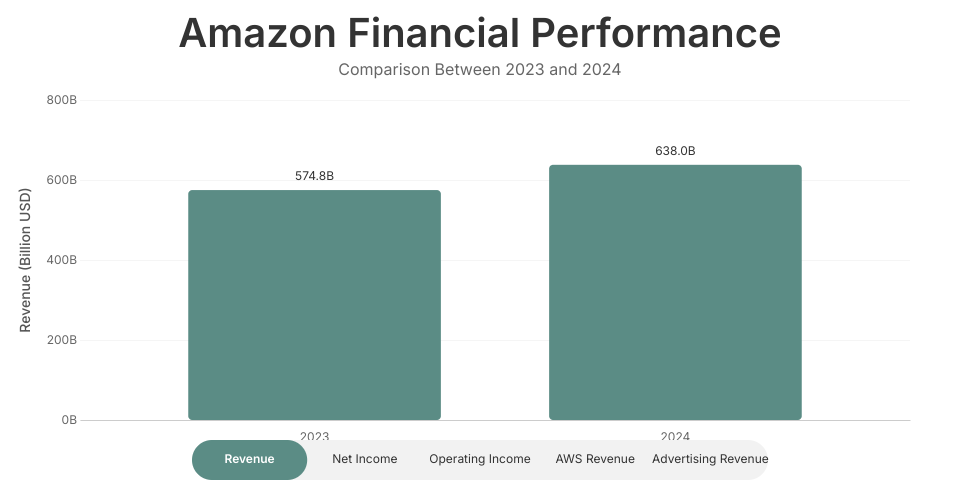
Amazon Financial Performance Visualization
This visualization compares Amazon's financial metrics between 2023 and 2024, including:
- Revenue
- Net Income
- Operating Income
- AWS Revenue
- Advertising Revenue
Users can switch between different financial metrics using the selector at the bottom of the visualization.
The chart displays the values in billions of USD and shows year-over-year changes.
MIT Licensed