🌍 Public
INFO 3300 - HW5
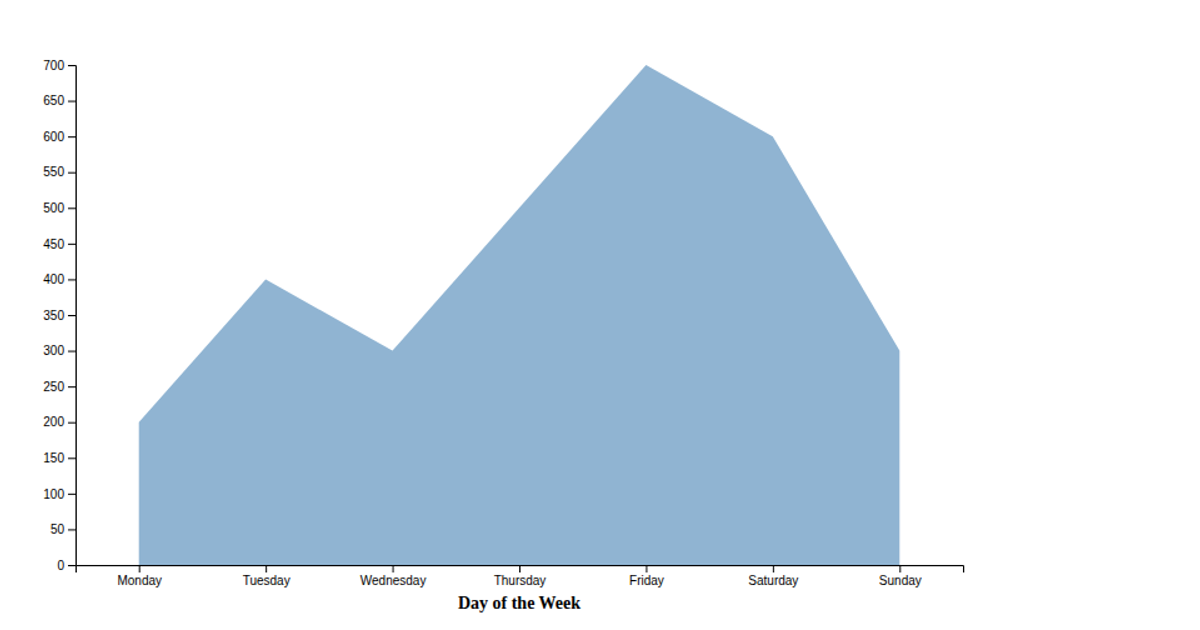
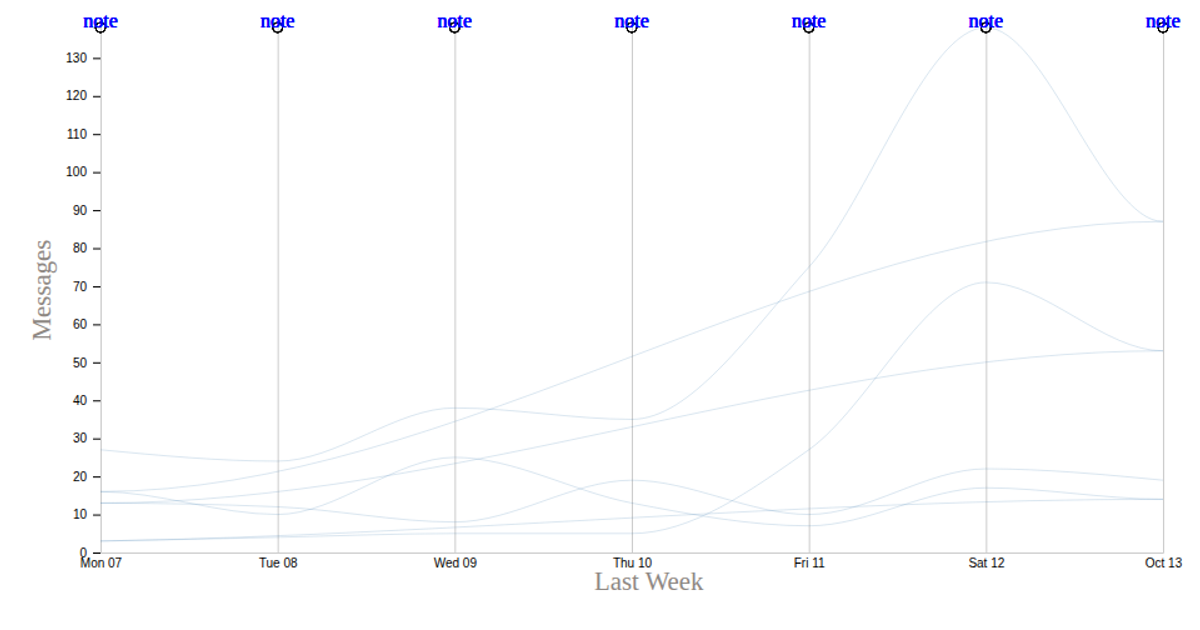
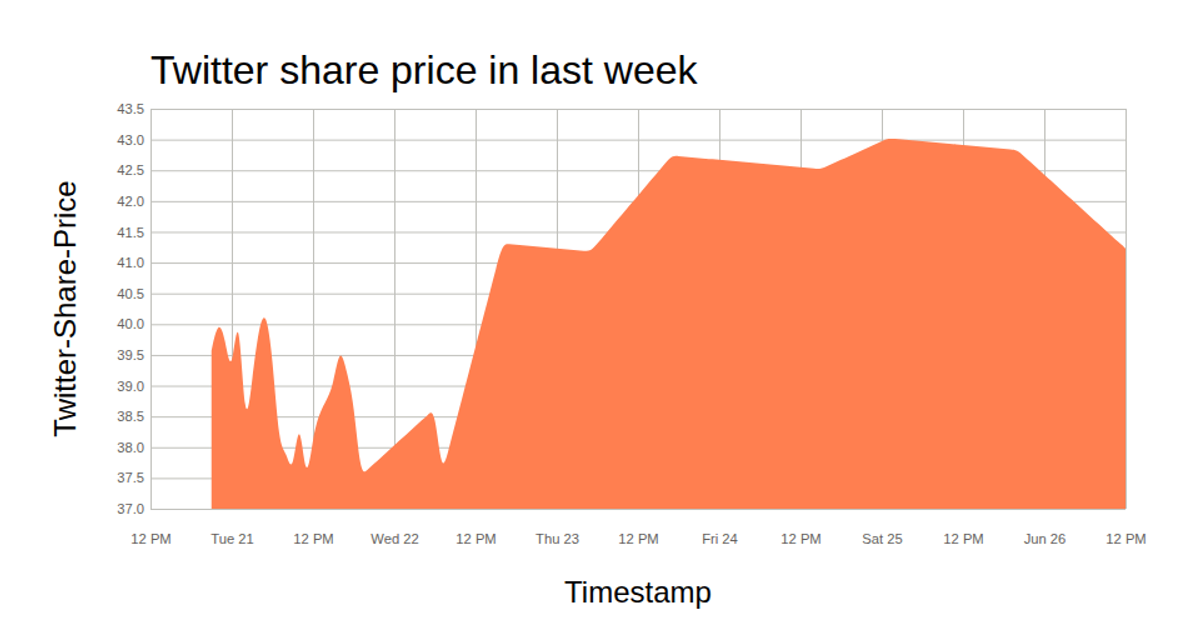
Two D3.js line-area charts visualize weekly tweet volume from a JSON dataset through SVG paths. The first chart plots three tweet categories over time using shared axes and scales. The second chart displays total tweet volume as an orange area with yellow stroke. Both use `d3.json` for data loading, `d3.scaleTime`, `d3.scaleLinear`, and `d3.axisLeft`/`d3.axisBottom` for axes. The time axis uses custom parsing with `d3.timeParse` and tick formatting with `d3.timeFormat`. Data is rendered via area generation, showing trend patterns across weekly dates.
AI-generated descriptionMIT Licensed




Comments
Sign in to join the discussion.