🌍 Public
Color and Size Legends
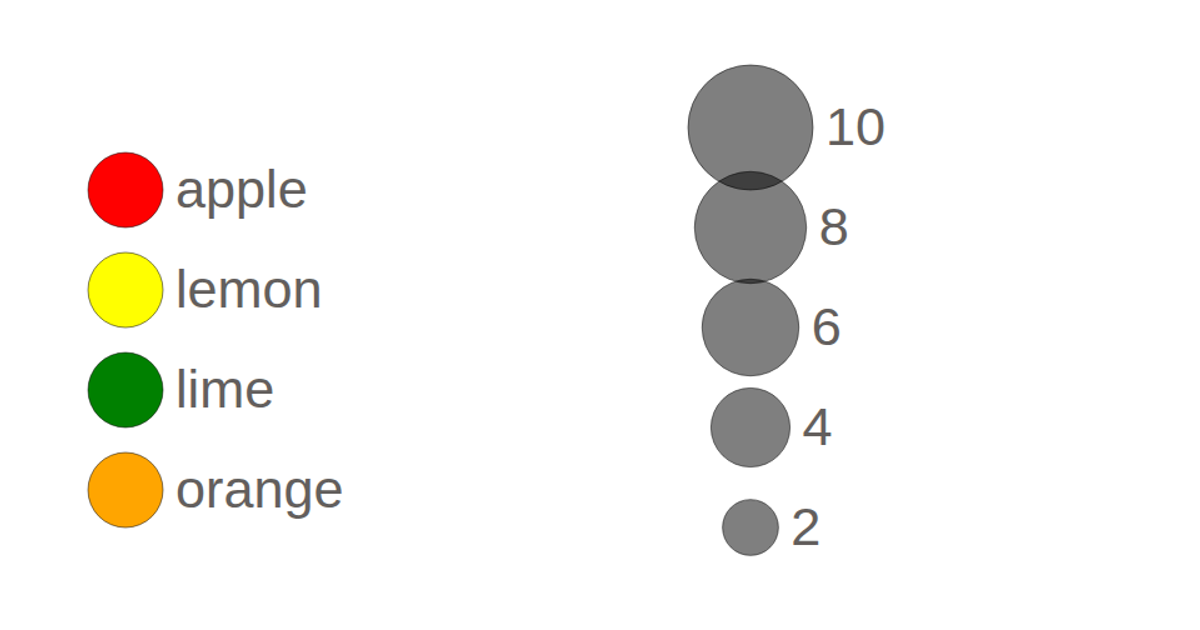
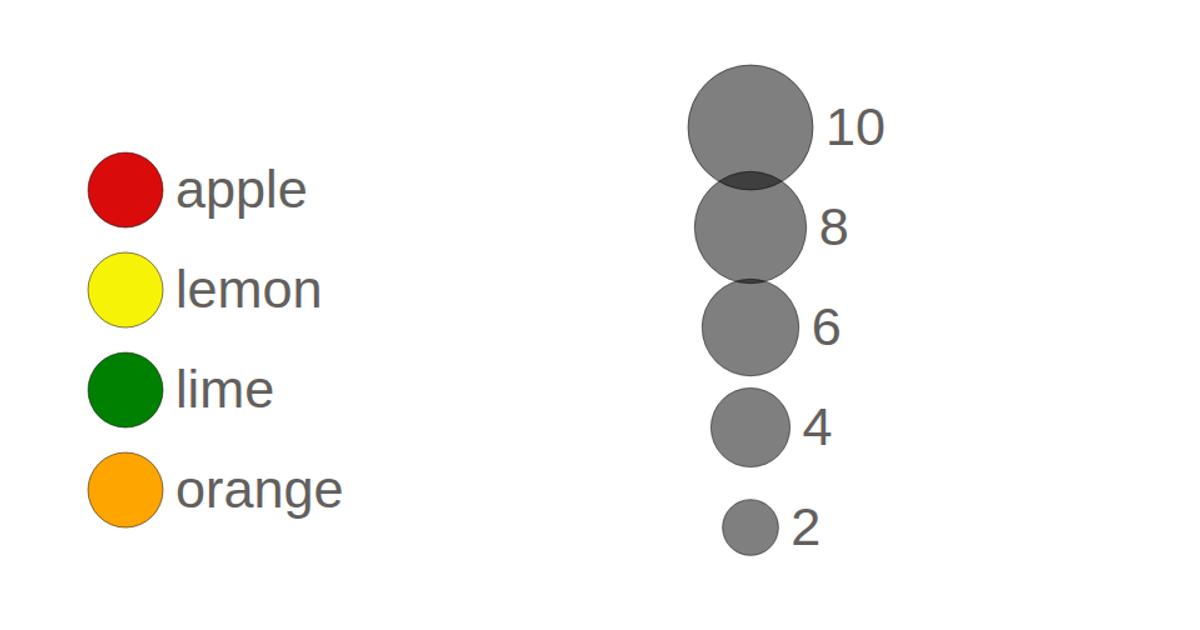
This example demonstrates two types of legends for scatterplot-like data. A color legend uses an ordinal scale to map fruit names to distinct colors, displayed with evenly spaced circles and labels. A size legend uses a square-root scale to map numeric values to circle radii, showing larger circles at the top with tick marks. Both legends are built with D3 v6 selections, using `.enter().append()`, `.merge()`, and `.exit()` to manage groups, with SVG circles and text rendered in an HTML page.
AI-generated descriptionColor Legend
MIT Licensed


Comments
Sign in to join the discussion.