🌍 Public
Color and Size Legends !
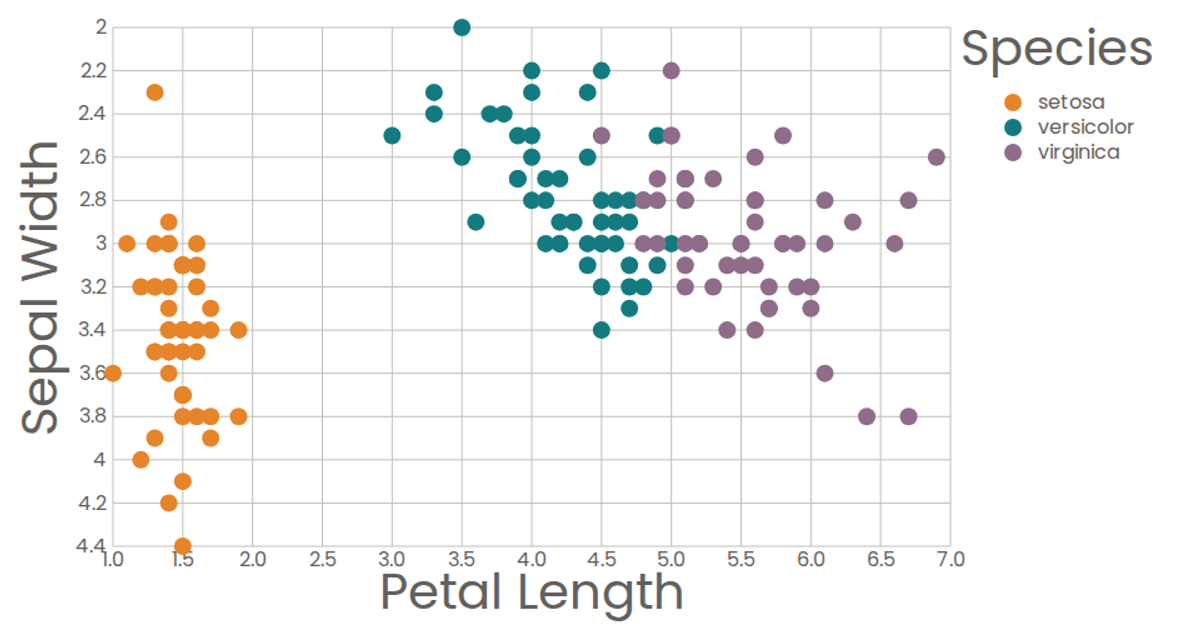
This example demonstrates customizable color and size legends for scatterplot-style data visualization. The color legend maps fruit names to distinct hues using d3.scaleOrdinal, while the size legend uses d3.scaleSqrt to translate numeric values into circle radii. Both legends are rendered as SVG groups, with reusable functions colorLegend and sizeLegend managing tick placement, circle attributes, and text labels. The implementation leverages D3 v5 data joins to update the legend elements dynamically.
AI-generated descriptionMIT Licensed




Comments
Sign in to join the discussion.