🌍 Public
Fork of Hospital Readmission Rates
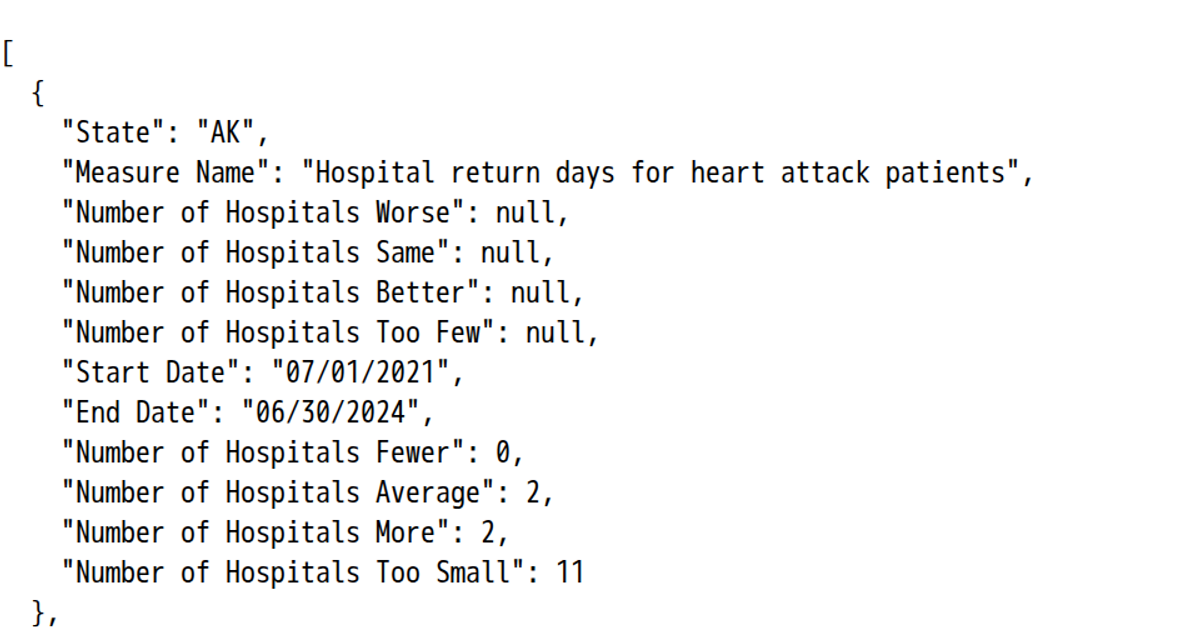
This example displays a fork of a hospital readmission rates visualization, loading data from a CSV file and rendering it as raw JSON text. The code uses D3 v7 to fetch and parse the CSV with `d3.csvParse`, converting "Not Applicable" values to NaN and numeric fields to numbers. State management is handled through a custom `setState` function, with the visualization updating whenever data changes. The implementation shows how to progressively load and process tabular healthcare data, preparing it for eventual graphical display.
AI-generated descriptionMIT Licensed




Comments
Sign in to join the discussion.