🌍 Public
Fork of Loading and Parsing COVID Hospitalizations Data
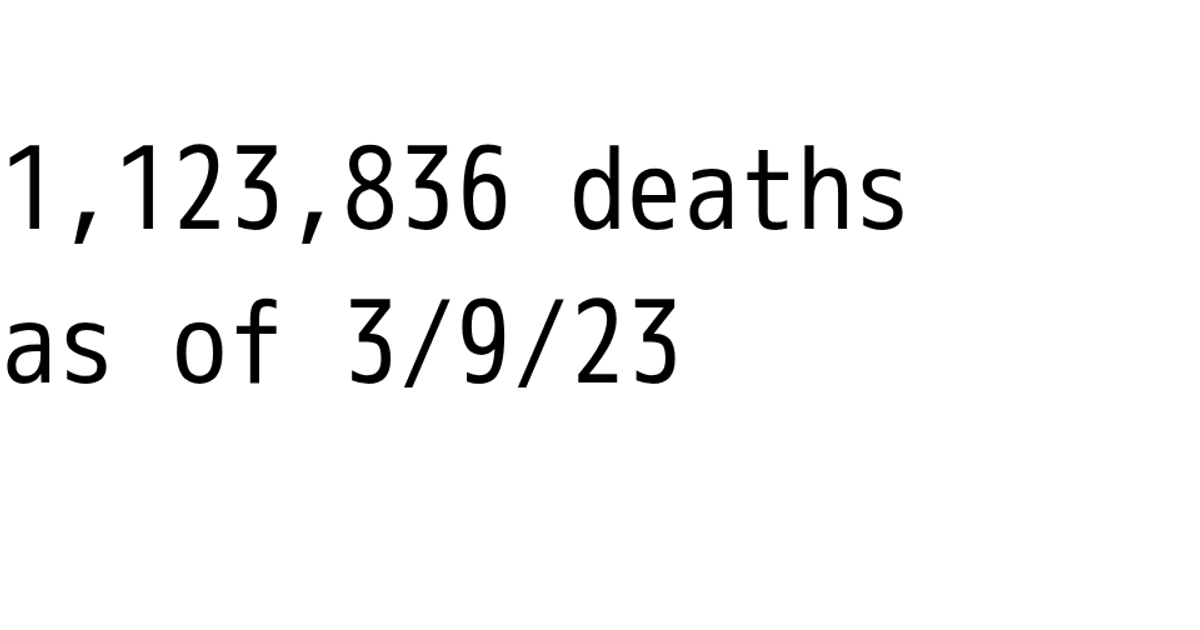
This example demonstrates how to load and parse a CSV dataset containing global COVID-19 hospitalization data from a GitHub gist, summing the latest column of case counts to display a single total in a large text element. It uses the D3.js v5 `d3.csv` method to fetch and parse the data asynchronously via a Promise, then applies a `reduce` operation to calculate the global case total. The code also includes commented-out alternatives using the Fetch API with `async`/`await` and `d3.csvParse`, along with a reference to the data columns.
AI-generated descriptionA program that loads and parses some CSV data: CSS Named Colors.
See also:
MIT Licensed





Comments
Sign in to join the discussion.