🌍 Public
Log Scale Powers of Ten Ticks
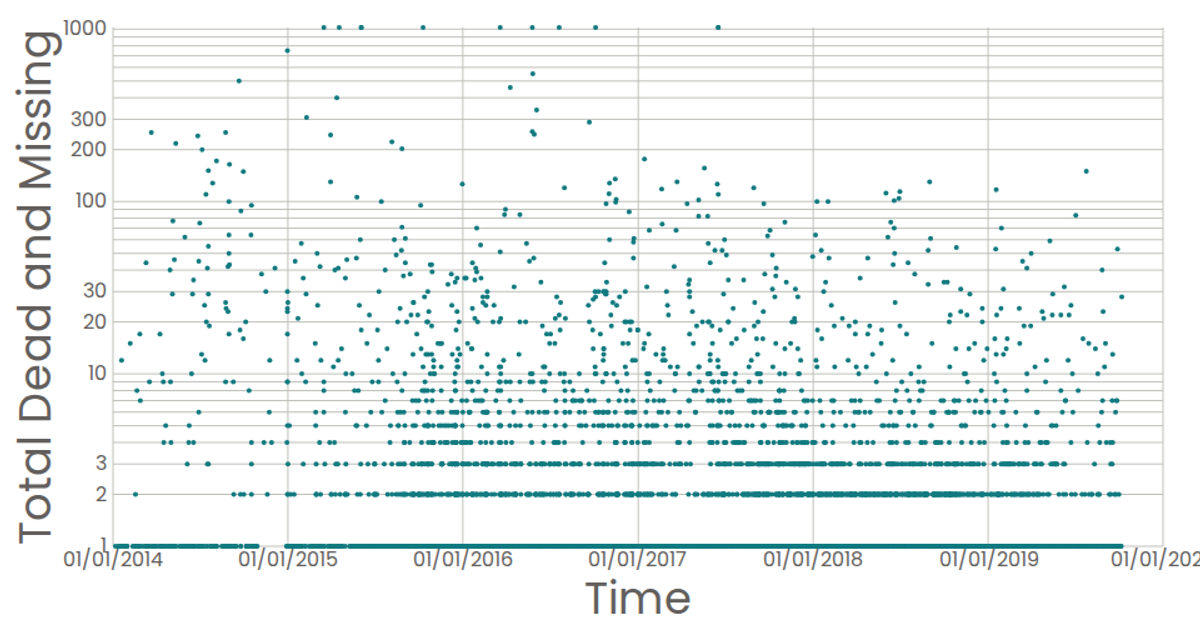
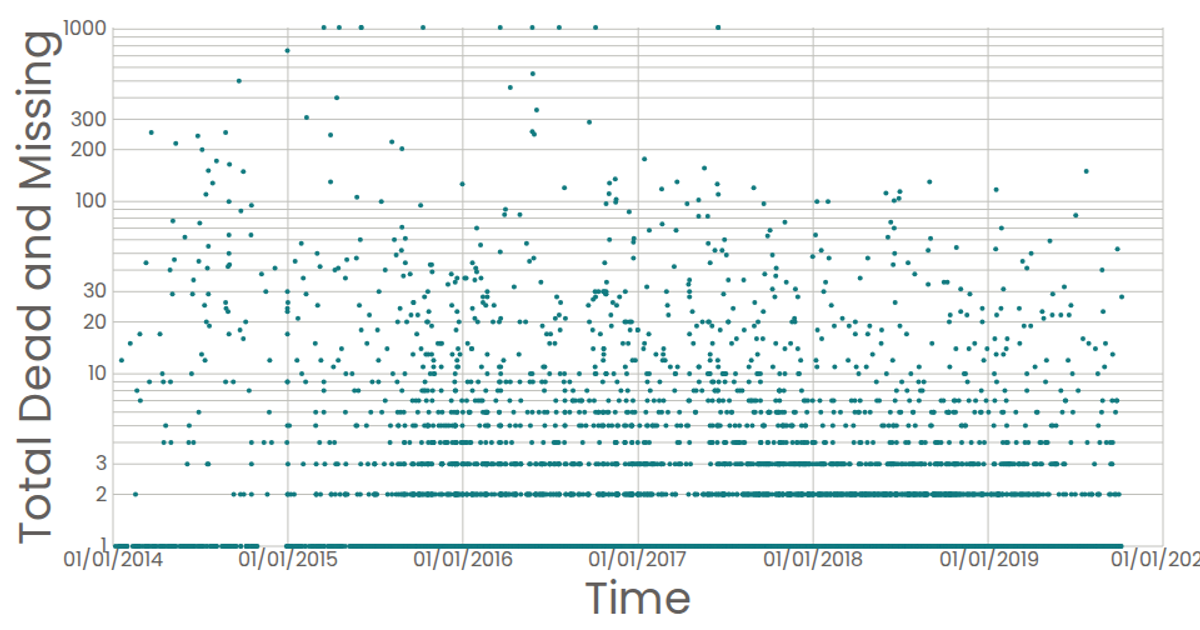
A scatter plot of the Missing Migrants Dataset, with each point representing an event. The y-axis uses a log scale, and the axis labels show only powers of ten (1, 10, 100) by filtering non-power-of-ten ticks. Built with React and D3 v5, it uses `scaleLog` and `scaleTime` for scales, and custom `AxisBottom` and `AxisLeft` components render SVG ticks and labels.
AI-generated descriptionA scatter plot of the Missing Migrants Dataset.
Each point in the plot represents a single event.
MIT Licensed




Comments
Sign in to join the discussion.