🌍 Public
charu 3D circles
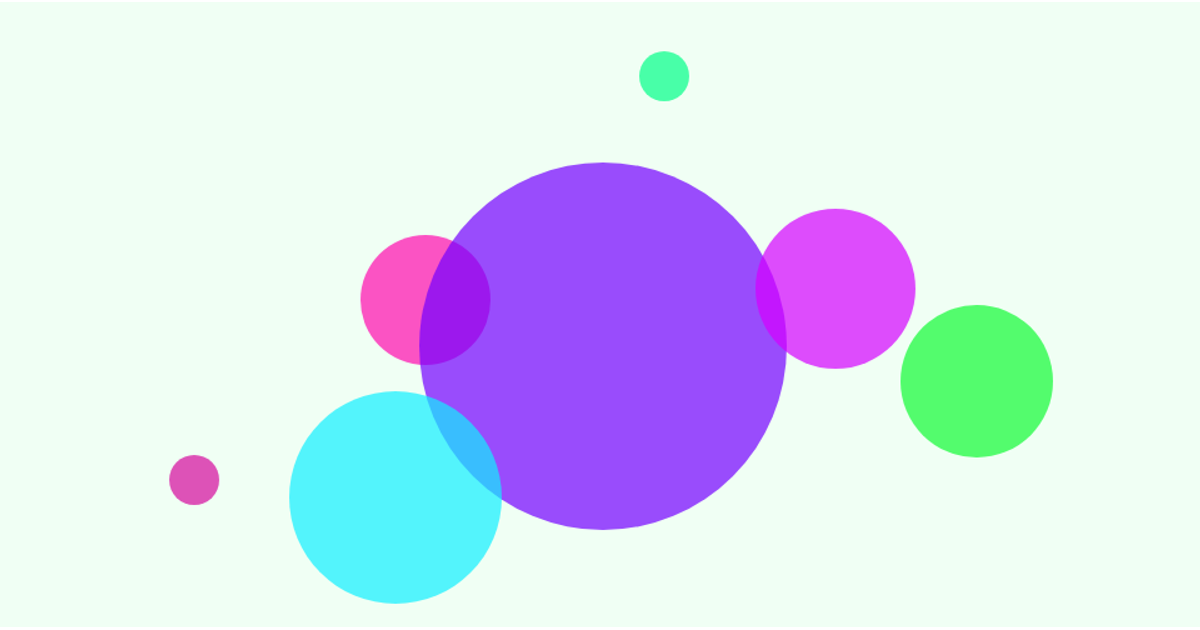
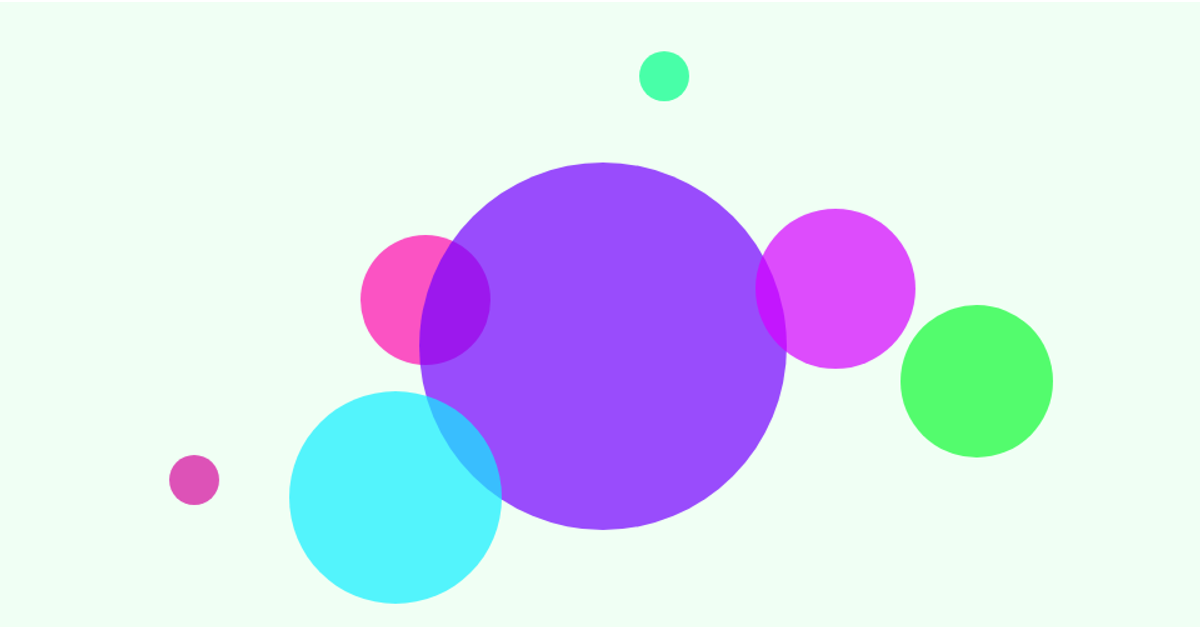
This example visualizes a set of seven semi-transparent circles of varying sizes and neon colors scattered across a light green background, creating a playful abstract composition. Each circle is positioned at fixed coordinates with distinct radii and fill values. The visualization uses D3.js v7, importing the `select` function to create an SVG canvas that fills the viewport, then binding the data array to `circle` elements. The code explicitly sets `cx`, `cy`, `r`, `fill`, and `opacity` attributes for each circle based on the provided data.
AI-generated descriptionMIT Licensed



Comments
Sign in to join the discussion.