🌍 Public
Fork of Fork of charu 3D circles
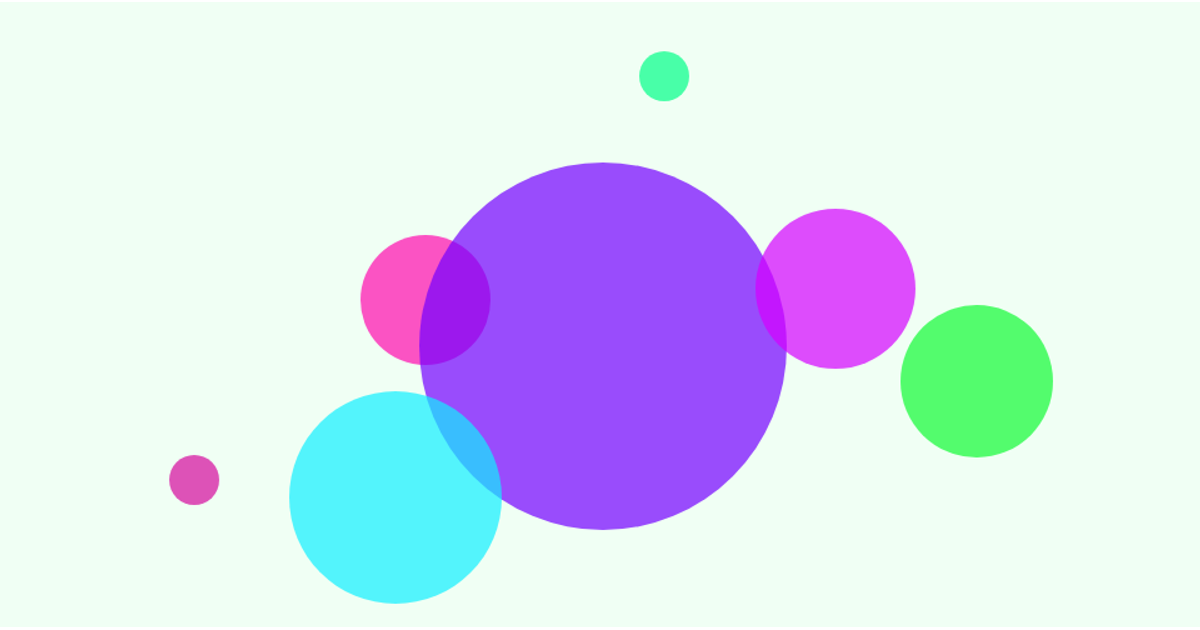
A static scatterplot of seven semi-transparent circles on a pale green background, each positioned with explicit x/y coordinates and varying radii and neon fill colors. The D3 v7 code uses `select`, `selectAll`, and `join` to bind hardcoded data to SVG circle elements, setting attributes like `cx`, `cy`, `r`, and `fill` directly. The visualization runs in a full-viewport container and demonstrates basic data binding and SVG rendering without animation or interactivity.
AI-generated descriptionMIT Licensed



Comments
Sign in to join the discussion.