🌍 Public
ICE-8 1b Sandeep Babu
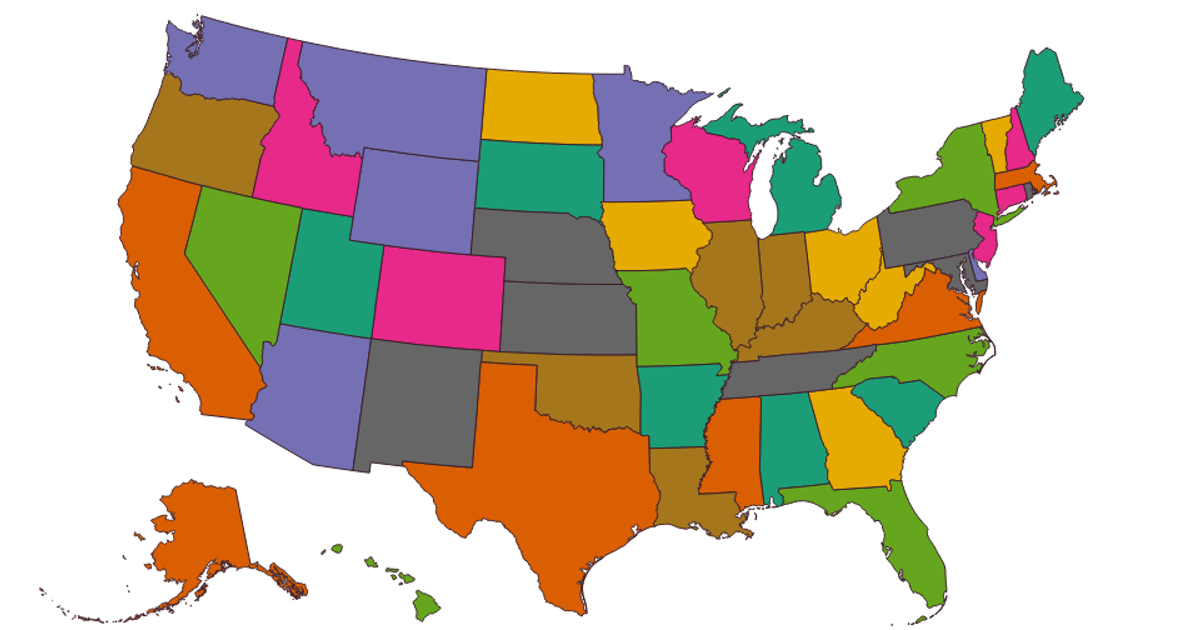
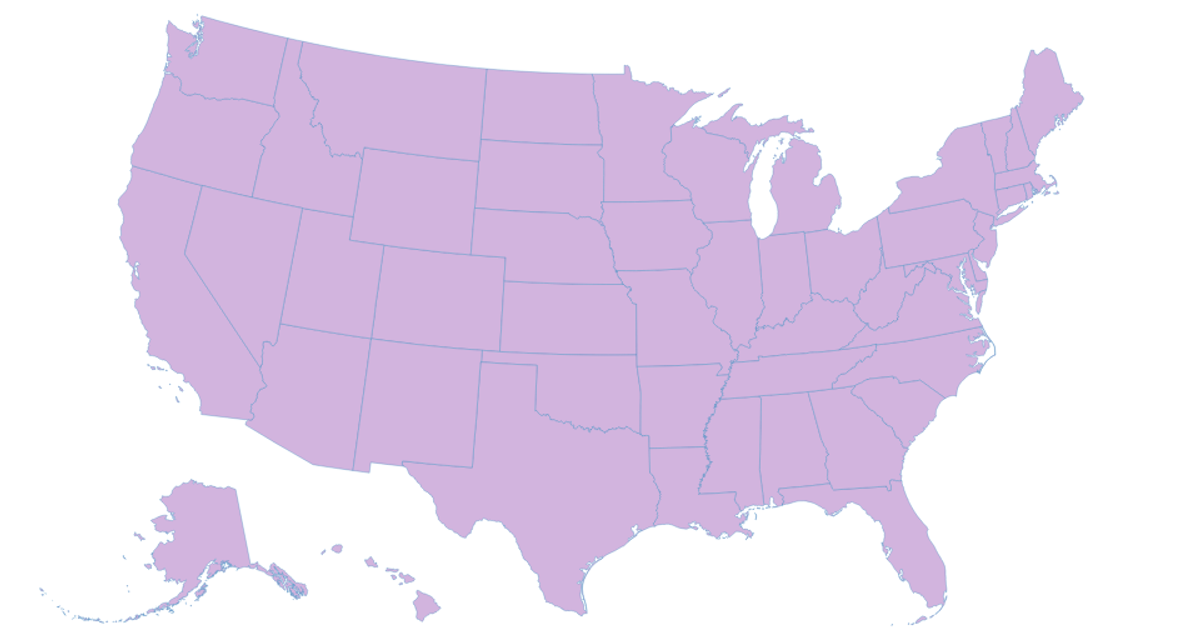
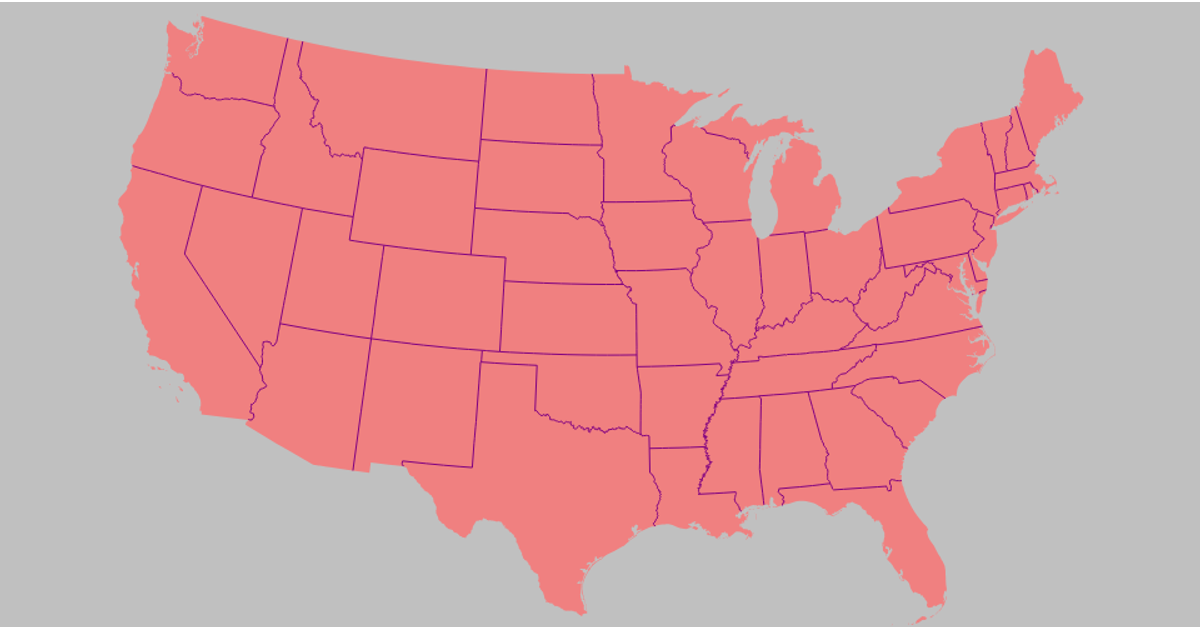
This choropleth map of the United States displays the number of universities per state, with darker orange shades indicating higher counts, based on hard-coded sample data for a subset of states. The visualization uses D3 v7 with the `geoAlbersUsa()` projection and the TopoJSON library to convert US state boundaries from a remote `us-atlas@3` TopoJSON file via `d3.json`. State regions are rendered as SVG paths styled with `d3.geoPath`, and their fill is determined by a sequential color scale. A custom tooltip, positioned on mouseover events, reveals precise university counts for each state.
AI-generated descriptionMIT Licensed





Comments
Sign in to join the discussion.