🌍 Public
ICE-8 1B Rithvik Reddy
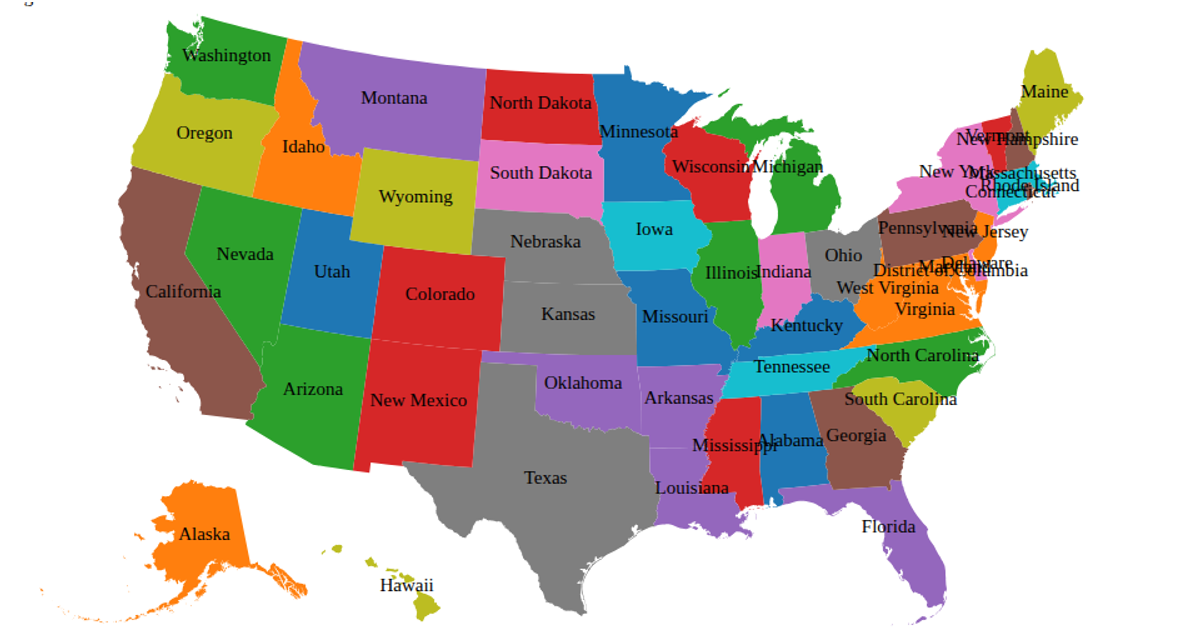
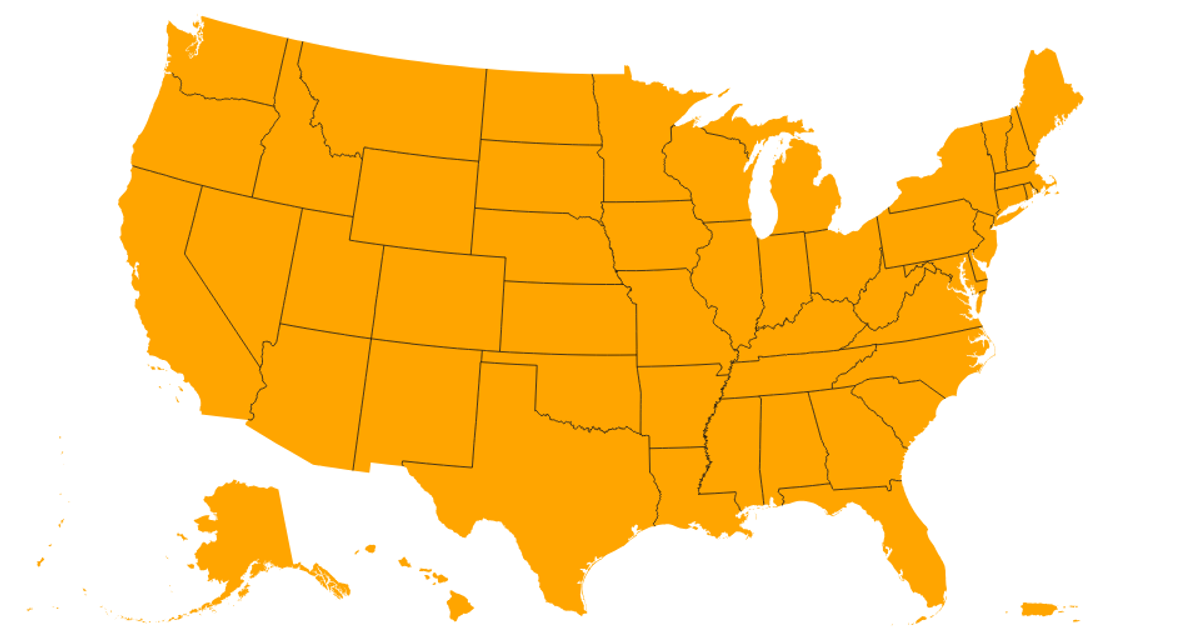
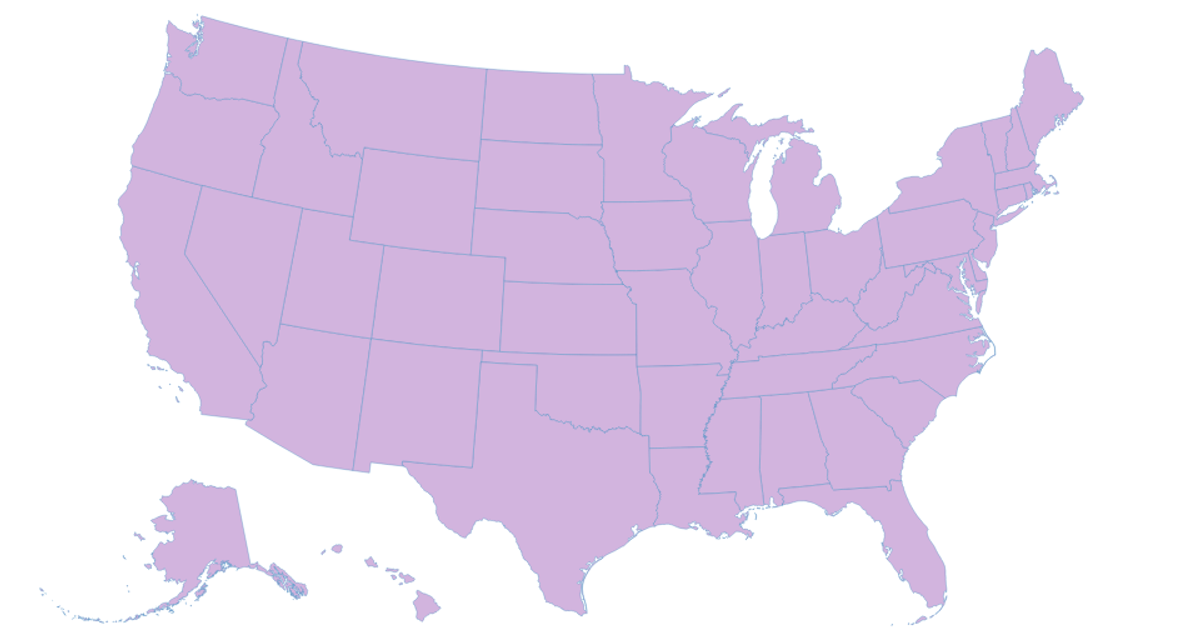
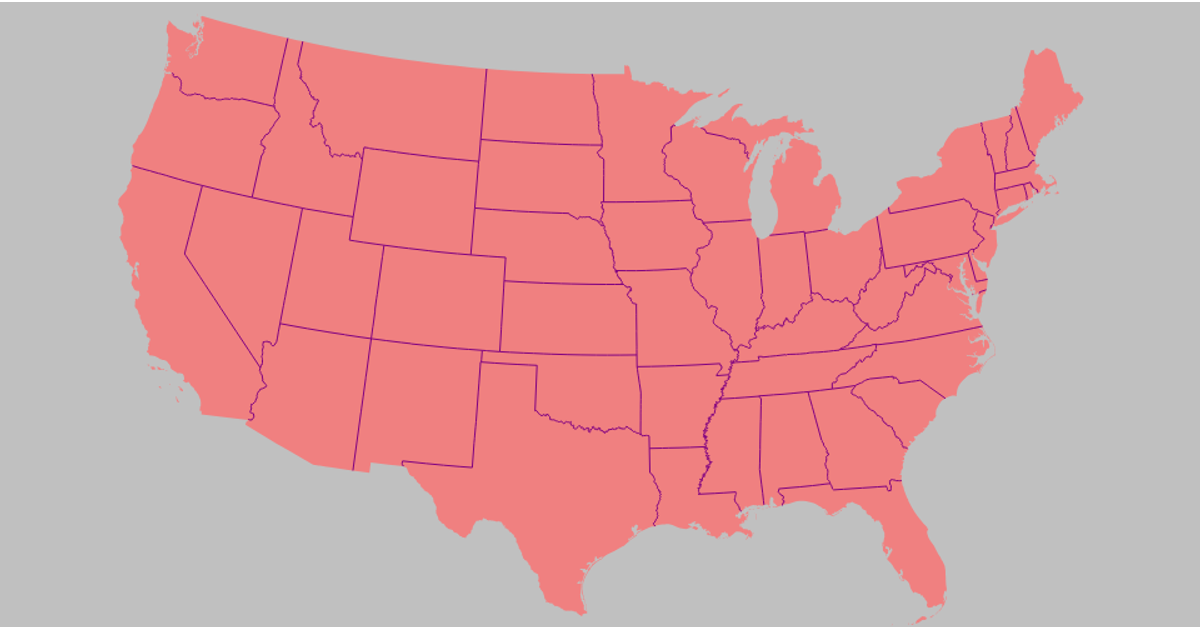
This choropleth map of USA states uses a light blue background and encodes FIPS codes with numeric values from a small inline CSV. The visualization maps each state’s data value to a color and shows a tooltip with the state name on hover. It loads TopoJSON state boundaries via the `us-atlas` package with a robust multi-URL fetch strategy, then projects them using `d3.geoAlbersUsa()` and renders the result with implicit SVG paths. The code also uses `topojson.feature` and `topojson.mesh` from the `topojson-client` library to extract state geometries and borders.
AI-generated descriptionMIT Licensed




Comments
Sign in to join the discussion.