🌍 Public
16. Axis with React & D3
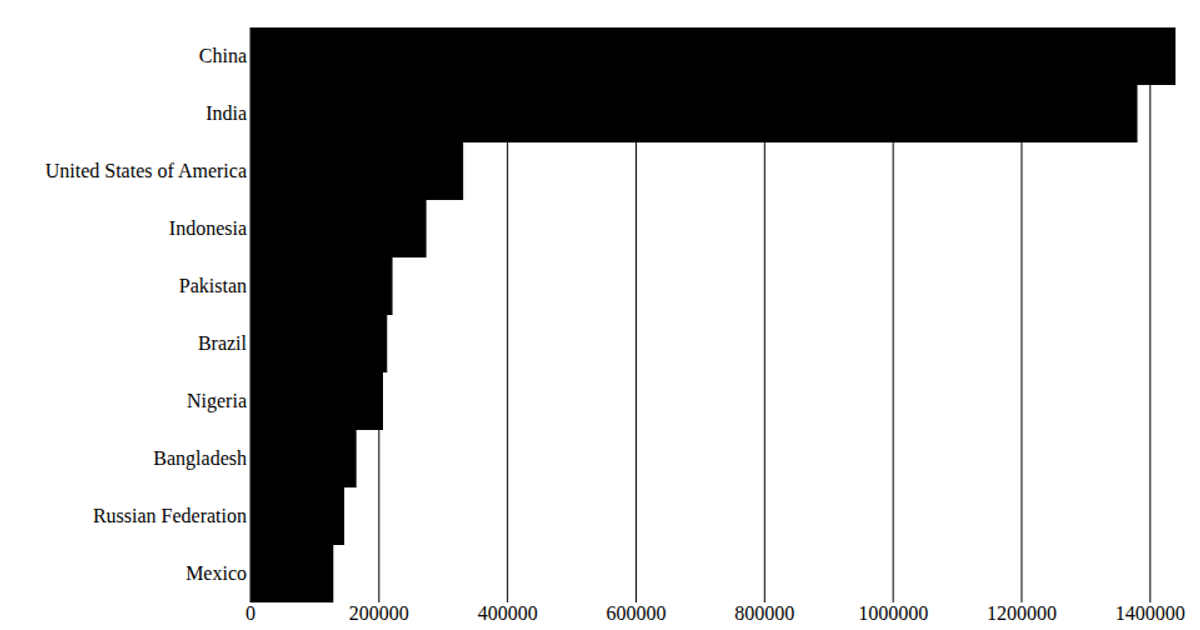
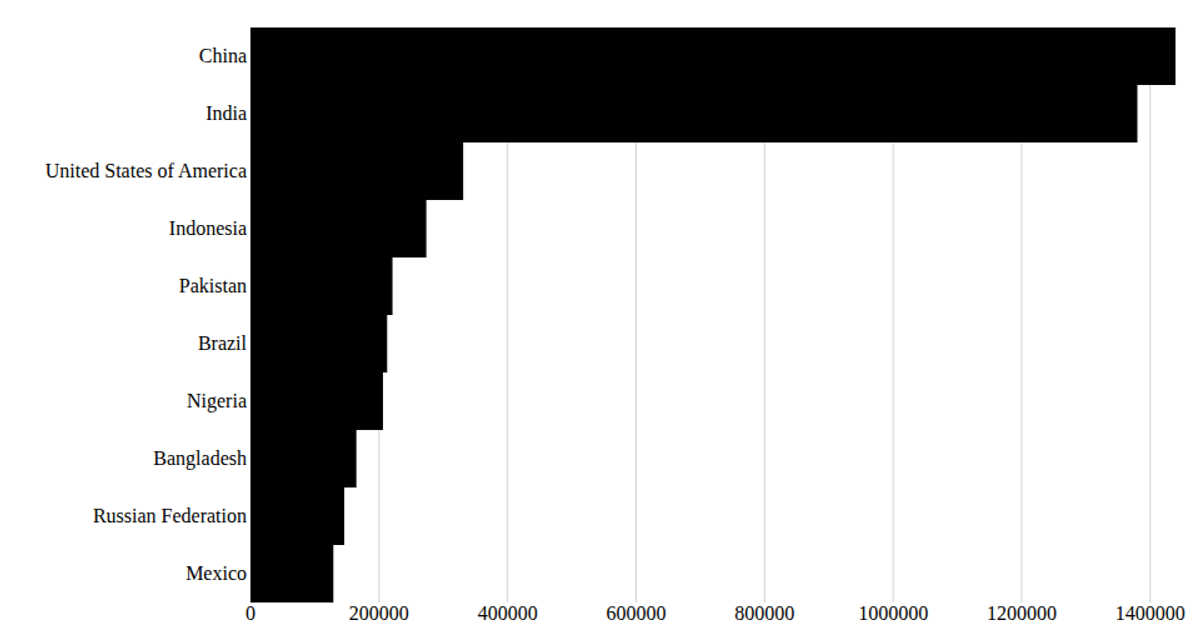
This example shows a horizontal bar chart of the top 10 countries by 2020 population, using SVG rendering with React and D3. It loads UN population data from a CSV file using d3.csv, then uses React hooks (useState, useEffect) to manage the data lifecycle. The chart implements custom axes: a linear x-axis with d3.scaleLinear and a band y-axis with d3.scaleBand, drawing tick marks and labels as React elements.
AI-generated descriptionA program that loads in some [data about CSS name colors] (https://gist.githubusercontent.com/curran/b236990081a24761f7000567094914e0/raw/cssNamedColors.csv) using D3 utilities, and uses React to render the data.
MIT Licensed





Comments
Sign in to join the discussion.