0 views in last 90 days
Prashish Paudel
@Prashish13
Public vizzes

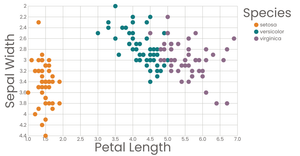
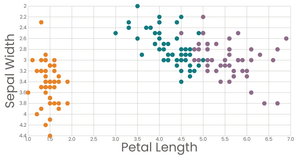
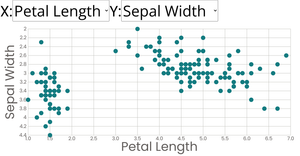
Rough of 2. Penguin Scatter Plot with Color Legend Interaction

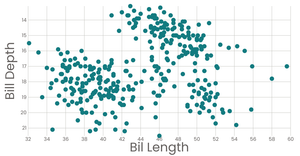
Rough of 1. Penguin Scatter Plot with Menus

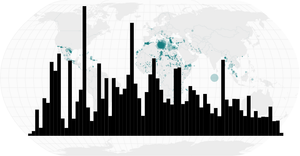
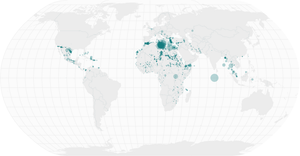
Rough of 4. Migrant Deaths Linked Views in World Map

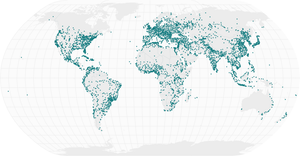
Rough of 3. Sized Points of Populated Cities on a Map

4. Migrant Deaths Linked Views in World Map
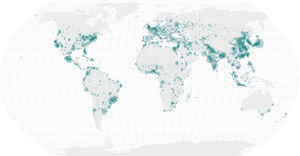
3. Sized Points of Populated Cities on a Map
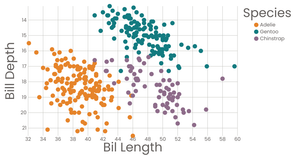
2. Penguin Scatter Plot with Color Legend Interaction

1. Penguin Scatter Plot with Menus
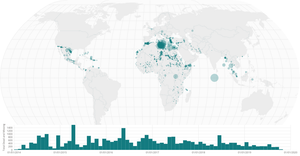
37 Migrant Deaths Linked Views with Fast Brushing

36. Multiple Views with Brushing

35. Multiple Views Cleanup
34. Missing Migrants Multiple Views
33. Migrants on a Map
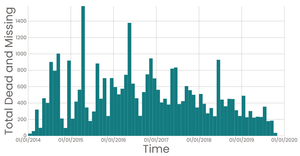
32. Missing Migrants Date Histogram
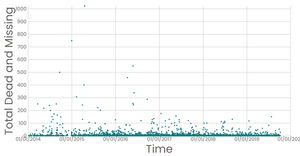
31. Missing Migrants Scatter Plot

30. Sized Points on a Map
29. Points on a Map

Penguin Scatter Plot With Interactive Color Legend
Penguin Scatter Plot

28 Scatter Plot With Interactive Color Legend
27. Scatter Plot with Color Legend
26. Scatter Plot with Color

Polished Penguin Scatter Plot with Menus

25. Polished Scatter Plot with Menus
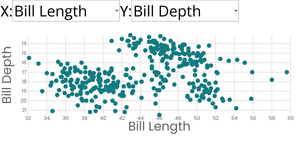
Penguin Scatter Plot with Menus
24. Scatter Plot with Menus
23. Menus with React

React starter Code
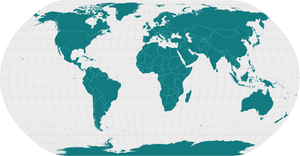
22. Making World Map using D3 and React

7. Loading and Parsing CSV Data

6. Face Part VI using multiple files with Compartmentalizing Complexity
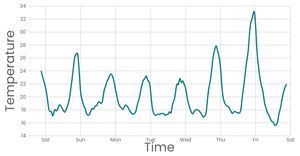
21. Stylized Line Chart
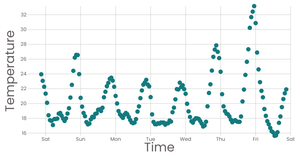
20. Working with Time
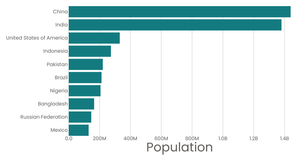
18. Stylized Bar Chart
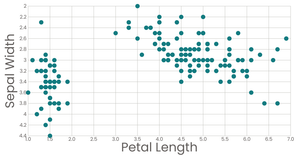
19. Stylized Scatter Plot
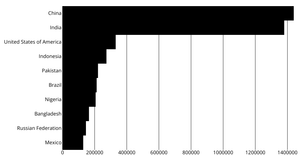
17. Refactored Bar Chart

16. Axis with React & D3

15. The Margin Convention

14. Making a Bar chart with React & D3

13. Visualizing data with React & D3

12. Rendering Data with React
11. Vega-Lite API

10. Loading Data in React

9. Parsing CSV Data using D3

8. Interacting with React(Mouse Follower)

5. Face Part V using multiple files with ES6 modules

4. Face Part IV using React Components & ES6

3. Face Part III using React & D3

2. Face Part II using React