🌍 Public
Orbis Global Database
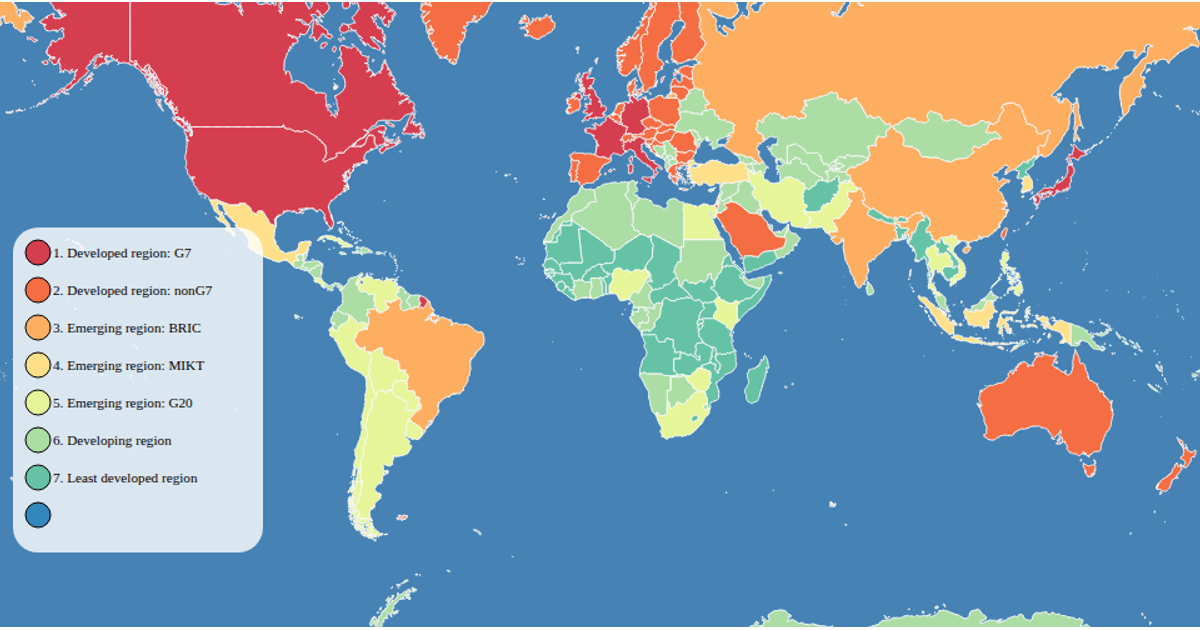
This interactive choropleth map visualizes financial metrics from the Orbis Global Database, displaying the mean CashFlow, Turnover, or TotalAssets for European countries across selectable years. Built with D3 version 7, the visualization uses `d3.geoMercator` and `d3.geoPath` to render SVG country boundaries, with a `d3.scaleOrdinal` color scheme encoding data values and hover tooltips showing country names. Data is loaded from a CSV file, while world geography comes from a GeoJSON source, and a dropdown menu triggers updates to the map.
AI-generated descriptionA demonstration of how to start using D3 version 6.
MIT Licensed



Comments
Sign in to join the discussion.