🌍 Public
Fork of sol lewitt repoduction
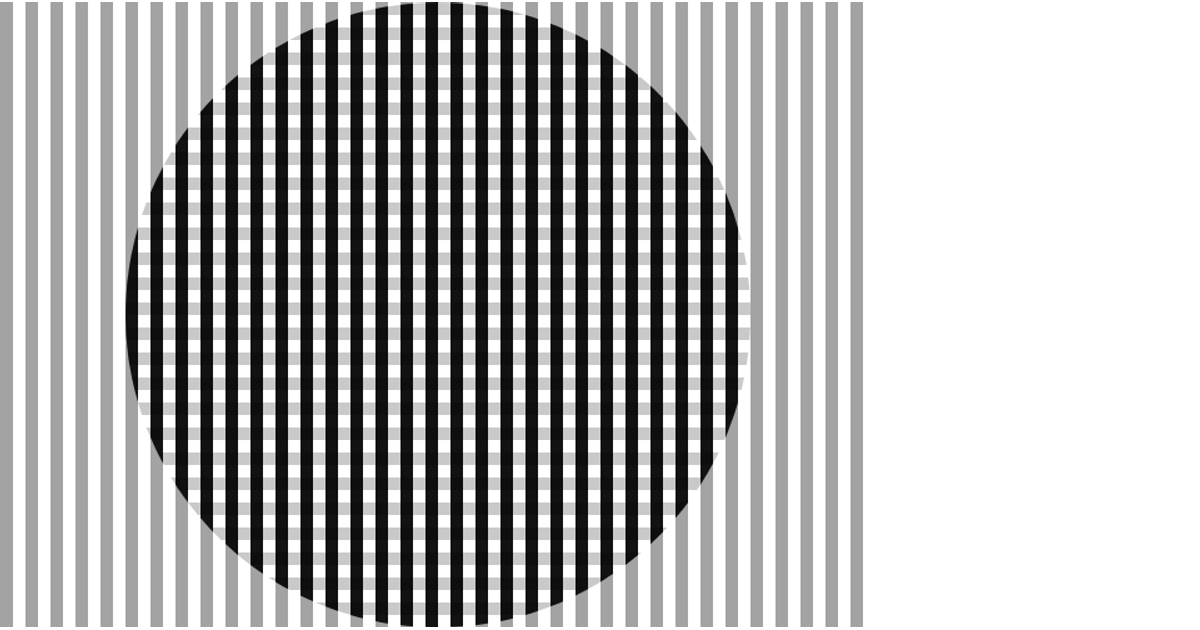
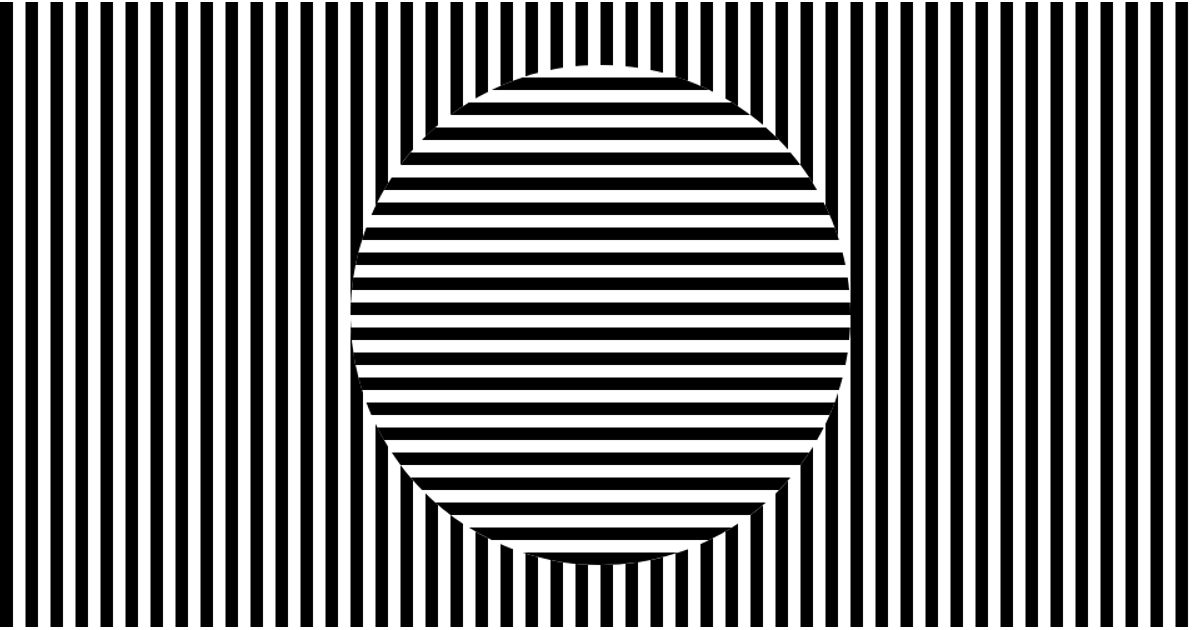
This visualization generates a grid of black rectangular bars descending diagonally across the viewport, producing an abstract pattern reminiscent of Sol Lewitt’s wall drawings. It uses the D3.js library’s `select` function to append an SVG element sized to the browser window. The code constructs an array of 100 objects, each defining a vertical position and bar dimensions, though the actual rendering loop is incomplete. The example demonstrates a minimal D3 setup with SVG creation and data styling.
AI-generated descriptionMIT Licensed




Comments
Sign in to join the discussion.