🌍 Public
tree diagram
SSaivignesh-9176
Last edited Mar 30, 2023
Created on Mar 30, 2023
Forked from Fork of Fork of Fork of Fork of ice8-vignesh
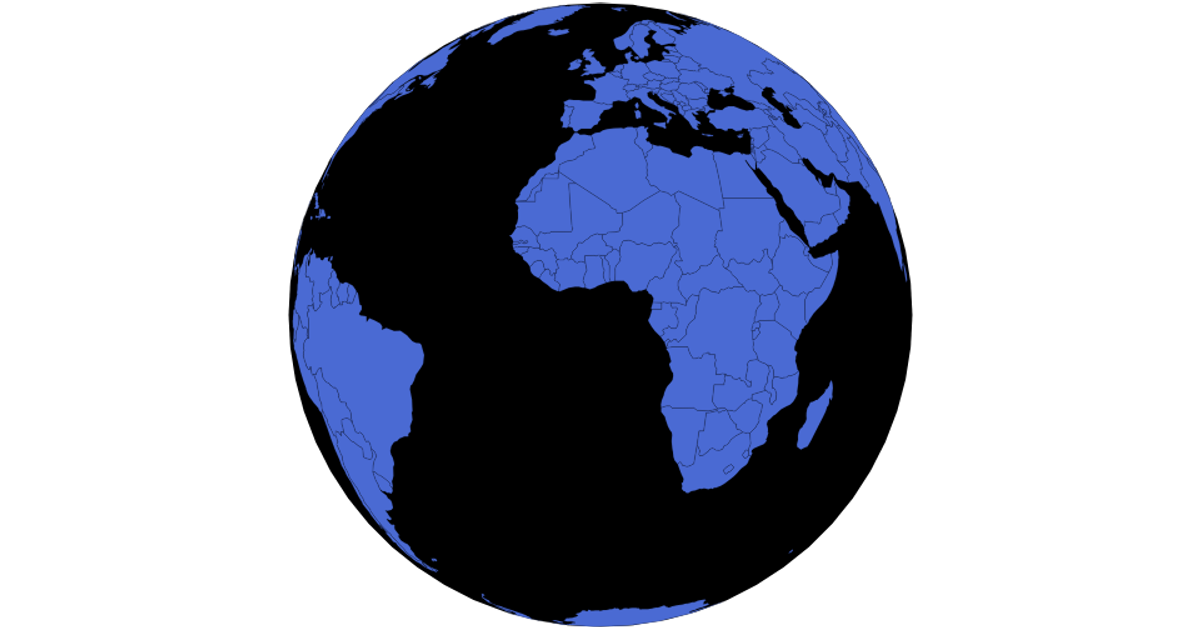
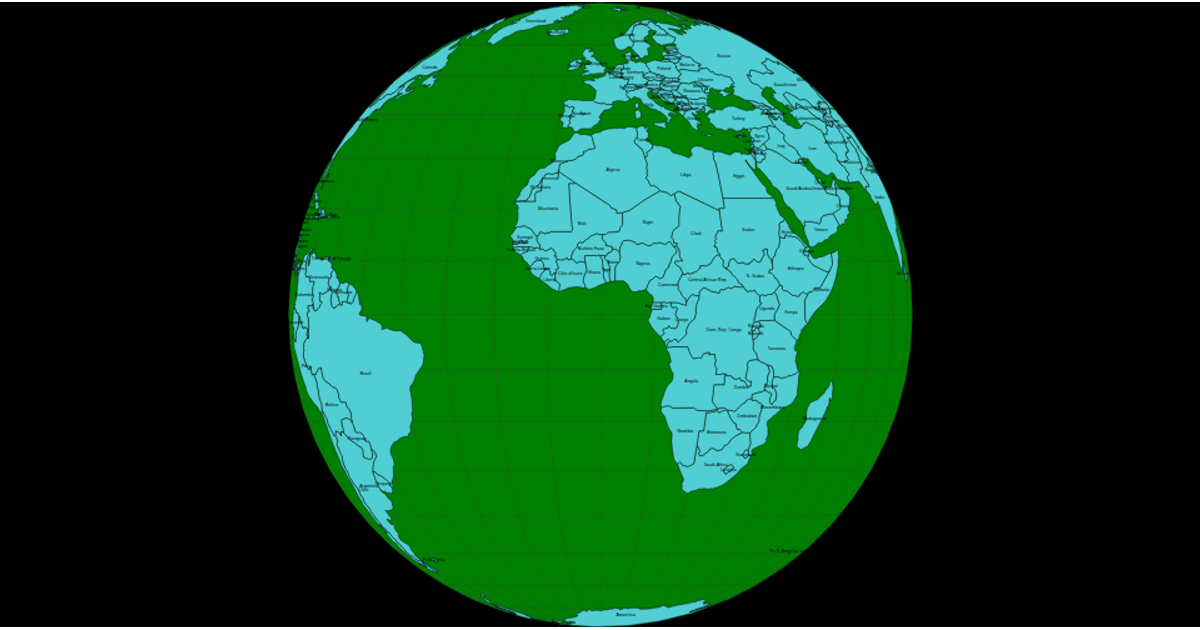
This interactive globe displays world country boundaries using a draggable and zoomable orthographic projection. Built with D3.js and TopoJSON, it loads country data from the world-atlas package and renders it as SVG paths via `d3.geoPath`. Users can click individual countries to switch between orthographic and Mercator projections, with a special case for the United States using `d3.geoAlbersUsa`. The visualization includes a graticule overlay and smooth 750ms transitions when updating, demonstrating dynamic geographic data exploration.
AI-generated descriptionMIT Licensed





Comments
Sign in to join the discussion.