🌍 Public
Multiple Views with Brushing
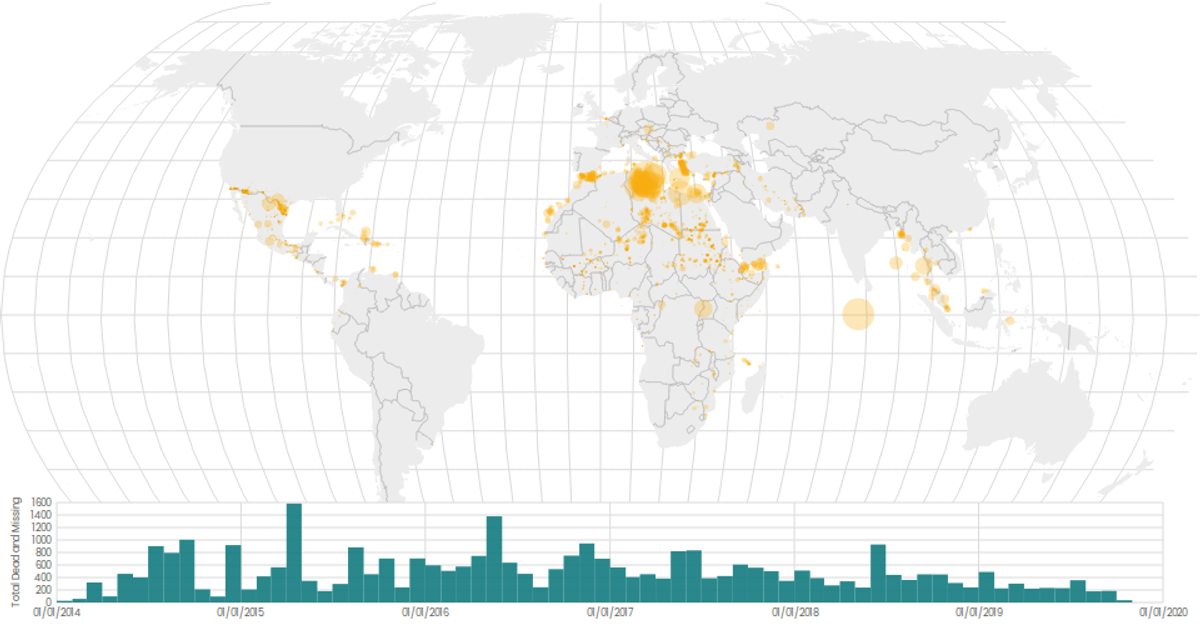
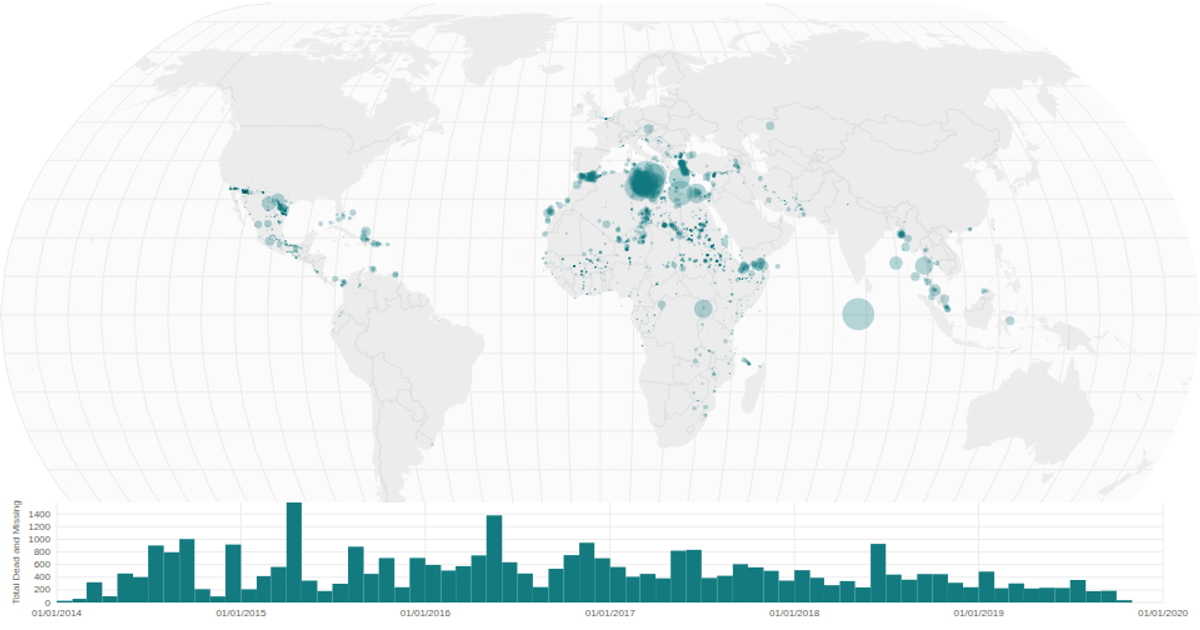
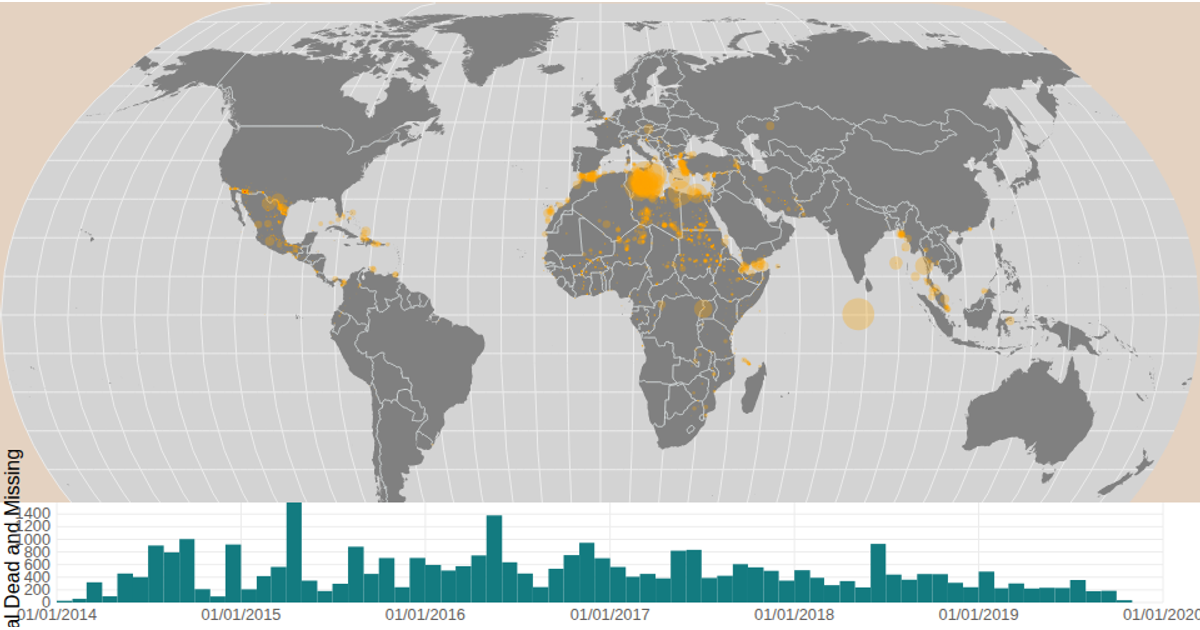
A map and timeline display migration data from the Data Canvas Sense Your City dataset. Brushing the time histogram filters the circles on a natural Earth projection, with circle size encoding total deaths and missing migrants. The visualization uses React, D3 v5 APIs including `geoNaturalEarth1`, `geoPath`, `scaleSqrt`, `bin`, `brushX`, and renders to SVG.
AI-generated descriptionA scatter plot of Data Canvas Sense Your City Dataset.
MIT Licensed




Comments
Sign in to join the discussion.