🌍 Public
Fork of Fork of Cheap Tricks for Interaction
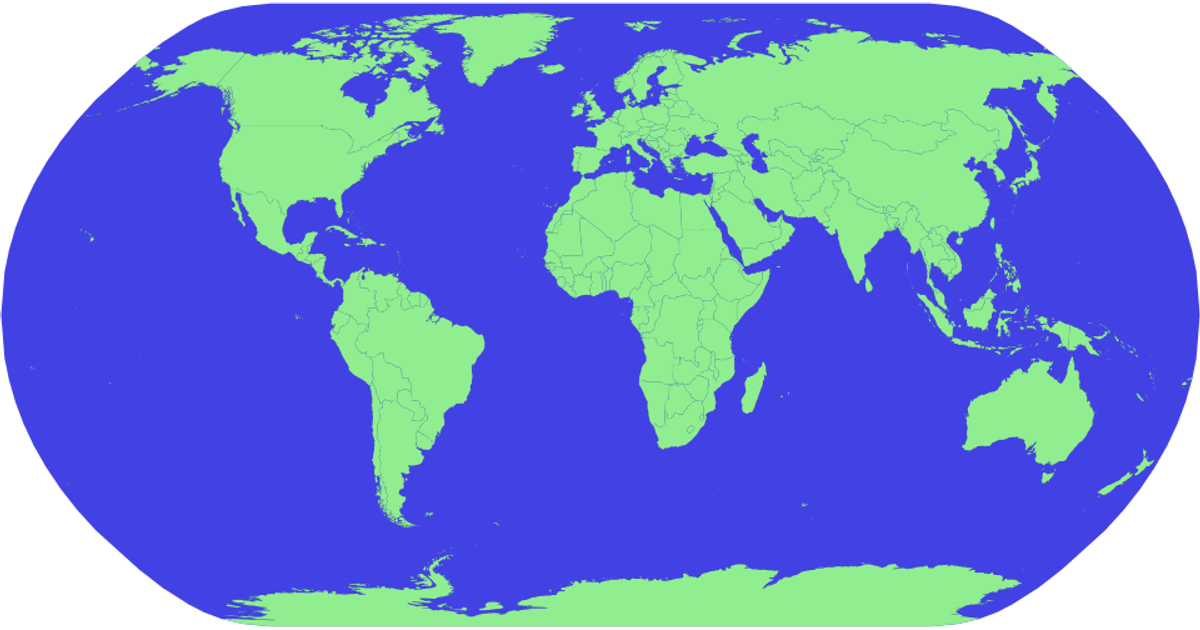
This interactive visualization displays a world map using a natural Earth projection, with countries rendered as light-green SVG paths that turn red on hover. The code leverages D3 v5’s `geoNaturalEarth1`, `geoPath`, and `zoom` APIs to enable panning and scaling via mouse or touch, transforming a grouped `<g>` element during zoom events. Country boundaries come from TopoJSON data in the world-atlas package, matched to names from a TSV file, with tooltips showing country names via appended `<title>` elements. The map is framed by a blue sphere path, and interaction is enhanced through CSS `:hover` styling.
AI-generated descriptionMIT Licensed




Comments
Sign in to join the discussion.