🌍 Public
Missing Migrants Data Part II
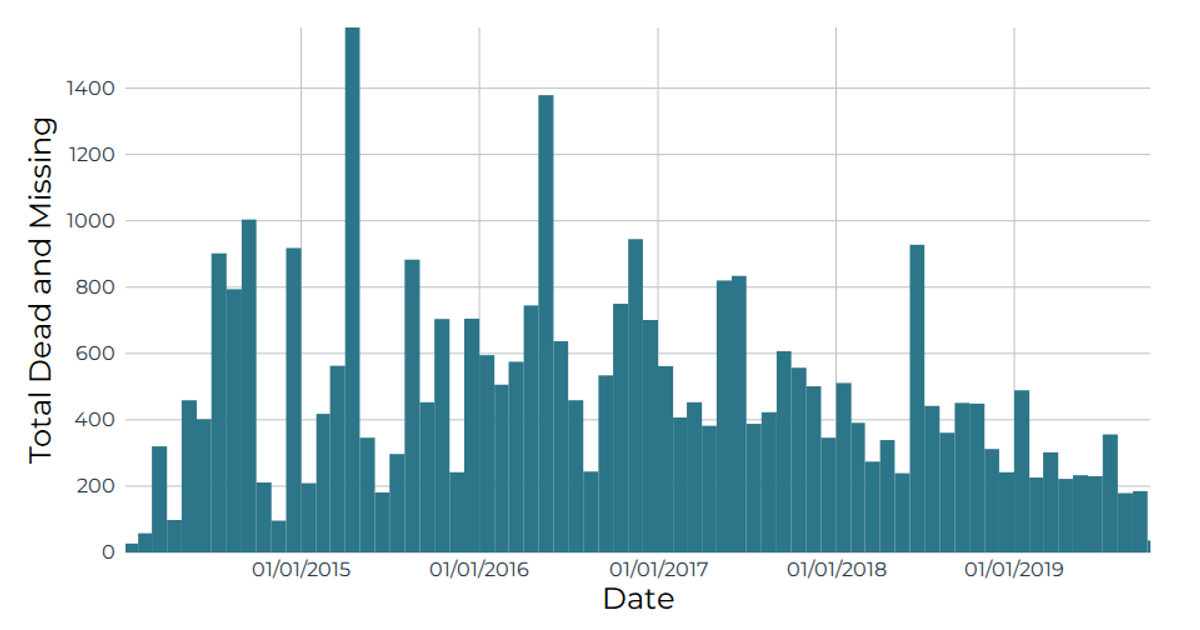
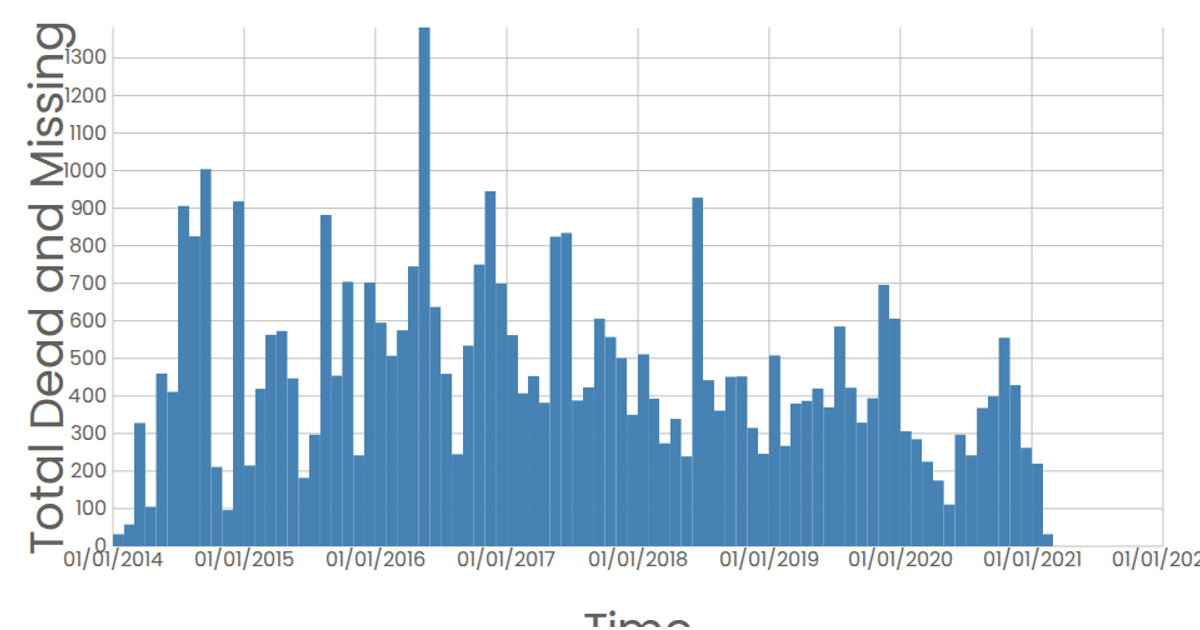
This interactive histogram visualizes the number of dead and missing migrants over time, using React to render SVG elements and d3.js utilities like `scaleTime`, `scaleLinear`, and `histogram` to bin the data by month. The chart displays total deaths per time period across the x-axis and frequency on the y-axis, with tooltips showing exact values. The data comes from a CSV file of Missing Migrants records, and axes are generated by custom React components using d3 scales.
AI-generated descriptionA scatter plot of MIssing Immigrants Data.
MIT Licensed





Comments
Sign in to join the discussion.