🌍 Public
Assignment2_Pvs
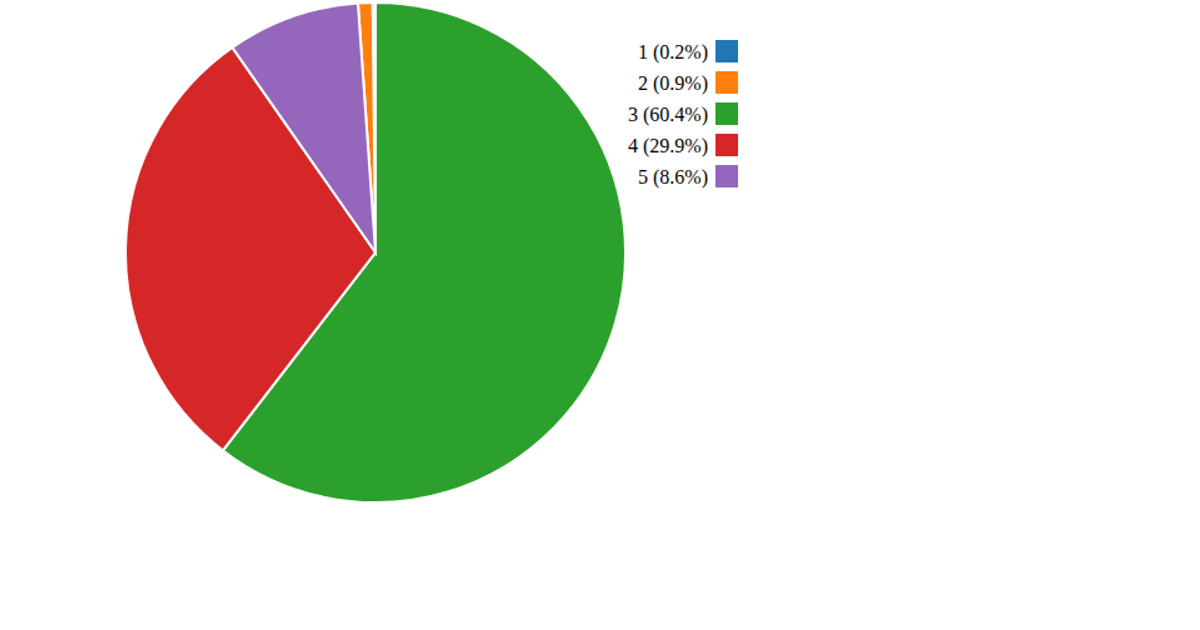
This pie chart visualizes the prevalence of seven common health conditions, with slices sized proportionally to each condition’s percentage. A legend identifies each condition, and hovering over a slice reveals its name via a tooltip. Built with D3 version 3, the visualization uses the `d3.layout.pie` and `d3.svg.arc` APIs to generate and draw the slices, along with a custom tooltip and color palette. The code constructs an SVG graphic and includes placeholder axis labels, with a static dataset embedded directly in the script.
AI-generated descriptionMIT Licensed




Comments
Sign in to join the discussion.