🌍 Public
question-1
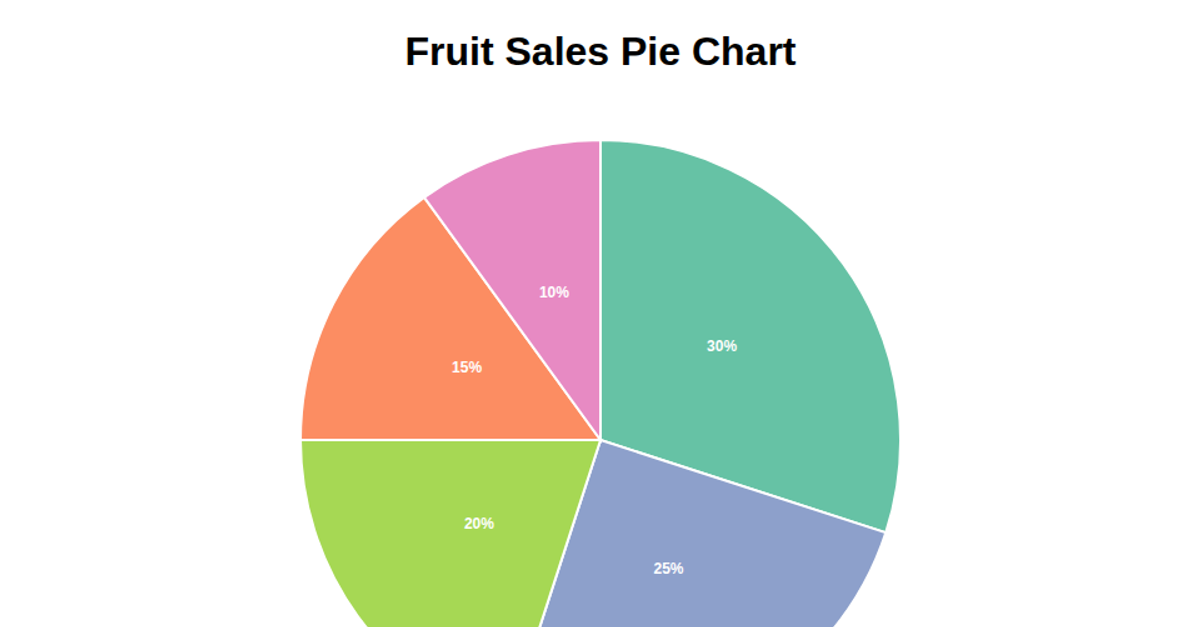
This example displays a pie chart visualizing disease frequencies, with sample data showing counts for Hypertension, Diabetes, and Arthritis. The chart uses D3 v7 to generate arcs via `d3.pie()` and `d3.arc()`, with an ordinal color scale from `d3.schemeCategory10`. It renders SVG paths and includes a separate HTML legend built with D3 selections, listing each disease and its count. The code also demonstrates ES6 module imports and axis label placement using SVG text elements.
AI-generated descriptionAn example showing the capabilities of VizHub:
- Loads D3 via UNPKG.
- Demonstrates use of
importfrom"d3". - Demonstrates use of
importfrom local ES6 modules.
MIT Licensed







Comments
Sign in to join the discussion.