🌍 Public
Activity6_Question4
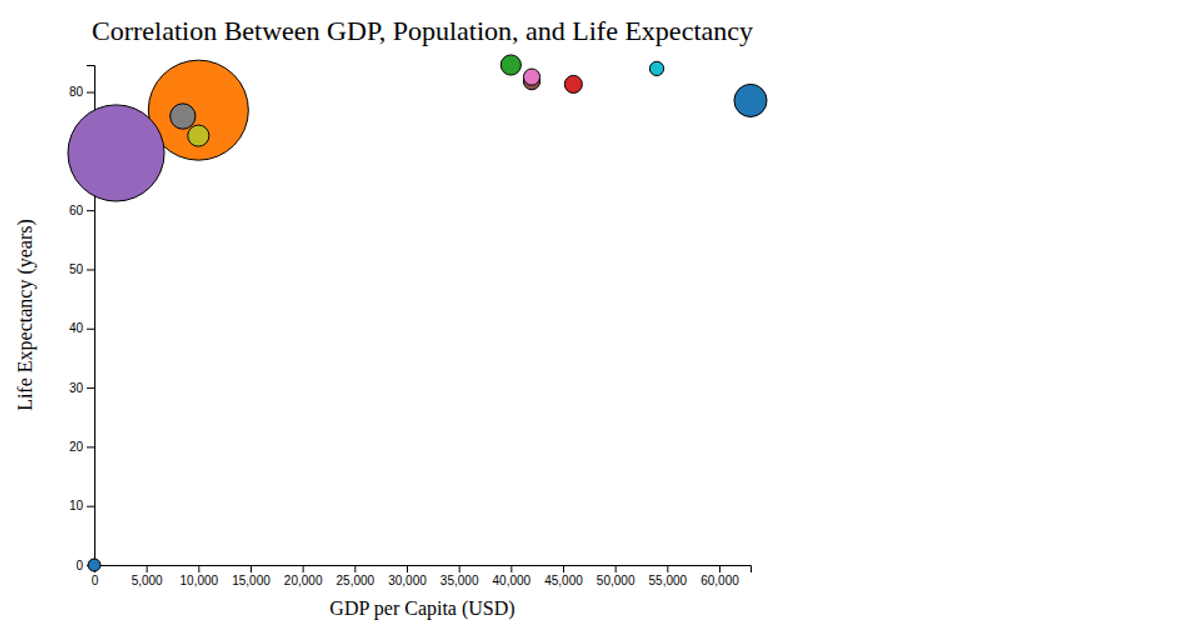
This interactive D3.js bubble chart visualizes fertility rate against life expectancy for ten countries, with bubble size representing population and color distinguishing geographic regions. The visualization uses an SVG-based rendering with d3.scaleLinear for axes and bubble sizing, and d3.scaleOrdinal with interpolated turbo colors for regional categorization. Hovering over any circle triggers a tooltip displaying the region name, implemented through mouse event handlers. The chart includes a size legend and a color-coded category legend. Data is loaded from a CSV file, and the visualization demonstrates animated transitions for tooltip opacity changes.
AI-generated descriptionMIT Licensed




Comments
Sign in to join the discussion.