🌍 Public
Warfarin BarChart with Custom Axis
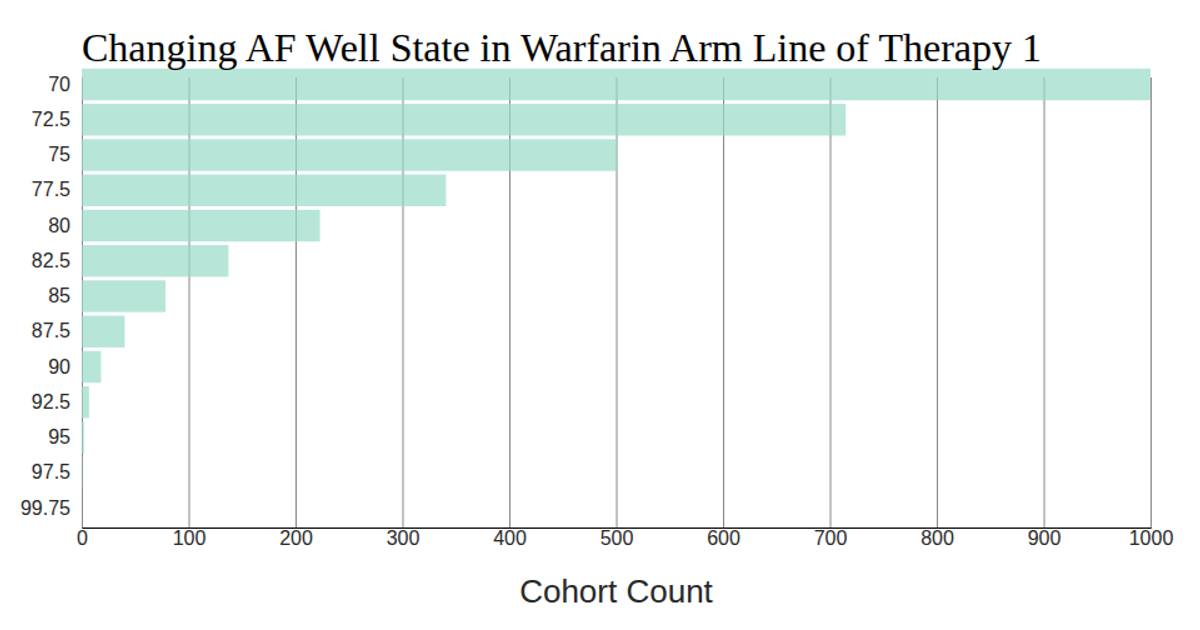
This bar chart displays the changing number of patients in the AF Well health state within the Warfarin Arm Line of Therapy 1 cohort across simulated years, with age on the y-axis and cohort count on the x-axis. Using D3 v5, the visualization employs a `scaleLinear` for counts and `scaleBand` for age groups. The SVG rendering includes a custom x-axis with tick lines extending through the chart, while the y-axis removes domain and tick lines. Data is loaded via `d3.csv` from the provided CSV file, with all numeric fields explicitly parsed.
AI-generated descriptionThis bar chart shows how the AF Well Population cohort changes across several years in the PRIME model.
MIT Licensed





Comments
Sign in to join the discussion.