🌍 Public
Covid Vaers Bar chart
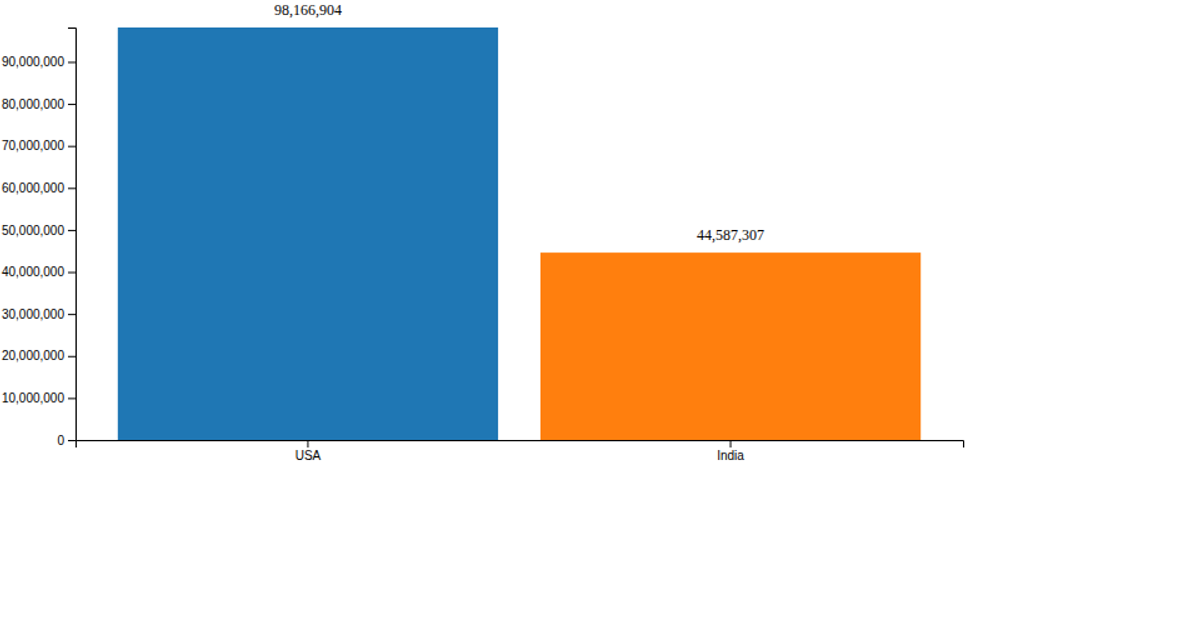
This bar chart visualizes hospital stay durations for COVID-19 vaccine adverse event reports, plotting patient ages on the x-axis against days hospitalized on the y-axis. Using D3 v6 with SVG rendering, the code employs `scaleBand` for the age categories and `scaleLinear` for the hospital days, while `axisBottom` and `axisLeft` generate the labeled axes. The visualization loads data from a local CSV file and initially parses numeric fields before rendering the static chart, with commented-out rect elements suggesting potential interactive hover animations that are not active.
AI-generated descriptionA demonstration of how to start using D3 version 6.
MIT Licensed


Comments
Sign in to join the discussion.