🌍 Public
Fork of Fork of Let's map a face with D3.js!
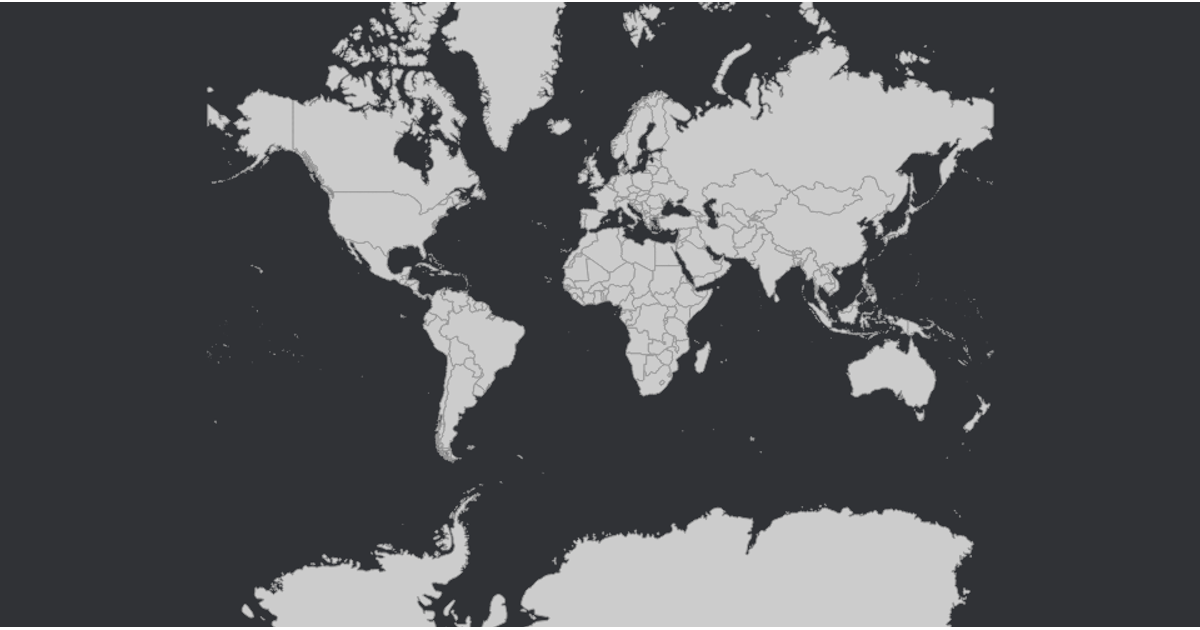
This example displays an interactive orthographic globe populated with country boundaries. Users can pan and zoom the map using mouse gestures. The visualization loads world topology from the World Atlas TopoJSON dataset and joins it with ISO country names from a TSV file. Country paths are rendered as SVG elements using `d3.geoPath` with a `d3.geoOrthographic` projection, while `d3.zoom` handles the interactive transforms on the containing group. Hovering over a country changes its fill color to grey.
AI-generated descriptionMIT Licensed






Comments
Sign in to join the discussion.