🌍 Public
Fork of Let's make a face with D3.js!
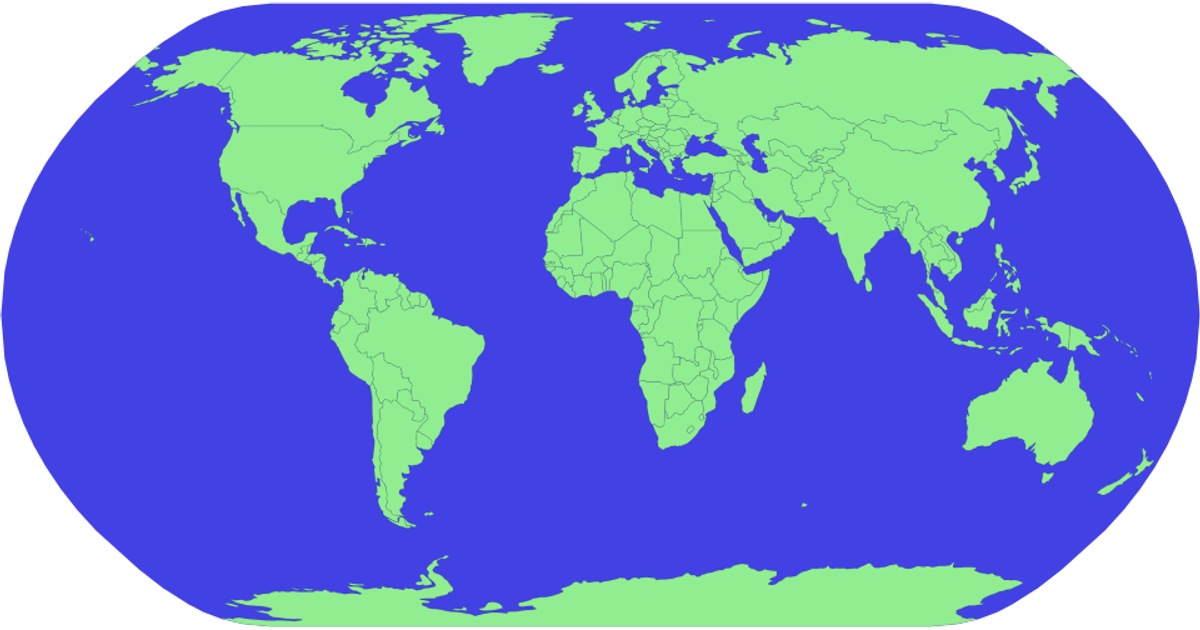
A world map rendered with D3.js displays countries as dark green paths with gold outlines on a gold sphere, using a Natural Earth projection and SVG. Hovering highlights a country in red, and zooming is enabled. The code loads geographic data from TopoJSON and country names from TSV files via Promise.all, then generates paths with d3.geoPath and applies pan/zoom through d3.zoom.
AI-generated descriptionMIT Licensed





Comments
Sign in to join the discussion.