🌍 Public
Stylezd Scattered Plot
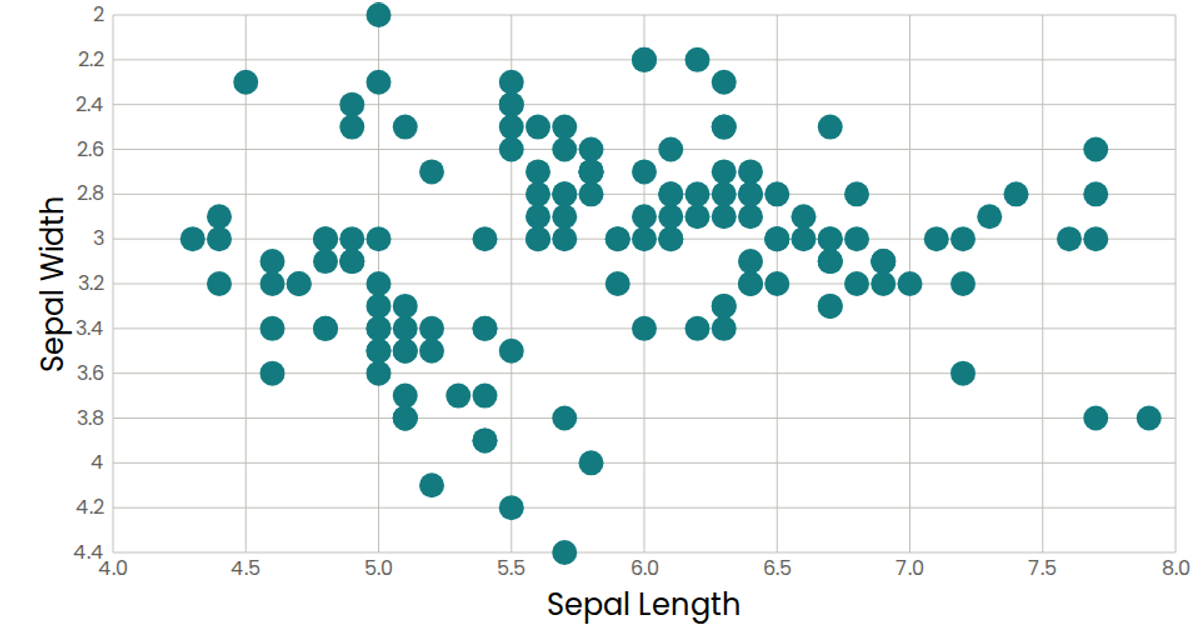
This scatter plot displays the relationship between sepal length and sepal width from the Iris dataset, with each flower represented as a teal circle. The visualization uses React with d3.v7’s `scaleLinear`, `extent`, and `format` functions to map data coordinates to SVG positions. Custom React components (`AxisBottom`, `AxisLeft`, `Marks`) render the axes and data points, while `useData` fetches and parses the CSV via d3.csv. Styled with the Poppins font and muted axis colors, the plot includes hover tooltips via SVG `<title>` elements.
AI-generated descriptionMIT Licensed




Comments
Sign in to join the discussion.