🌍 Public
Stylezed Bar Chart
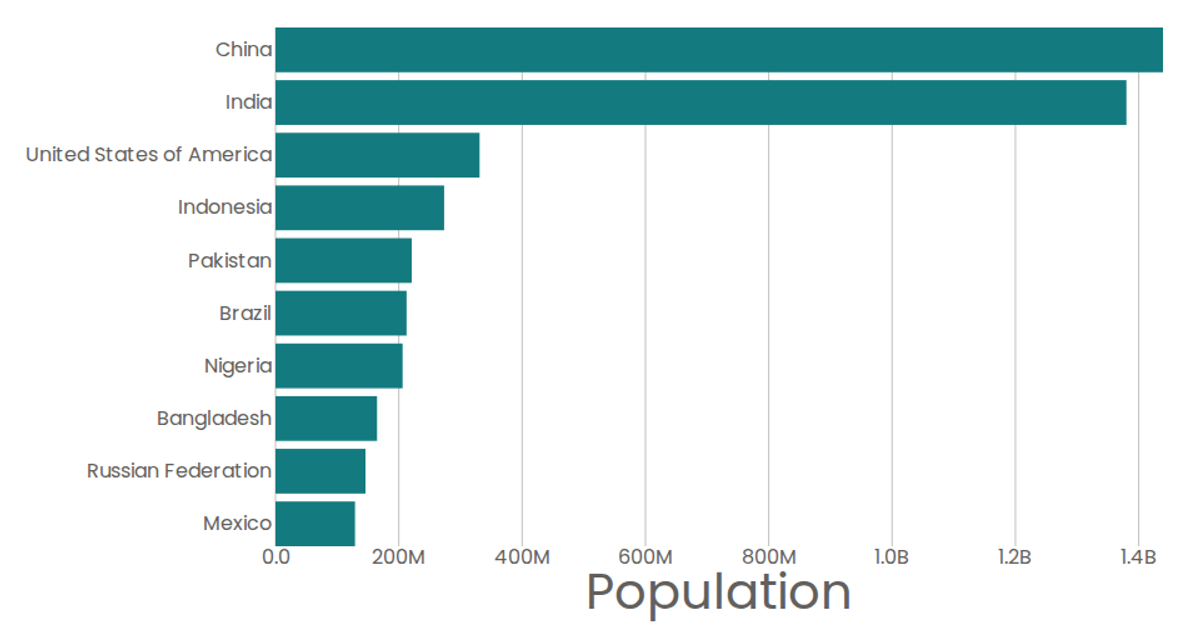
A horizontal bar chart displays the populations of ten countries from a 2019 UN dataset, with country names on the y-axis and population values on the x-axis. The React component uses d3.scaleBand and d3.scaleLinear to map data, while d3.format formats tick labels. SVG rectangles render each bar, with native `<title>` elements providing tooltips. Axis components draw ticks and labels, and the chart updates automatically when data loads via a custom `useData` hook.
AI-generated descriptionMIT Licensed



Comments
Sign in to join the discussion.