🌍 Public
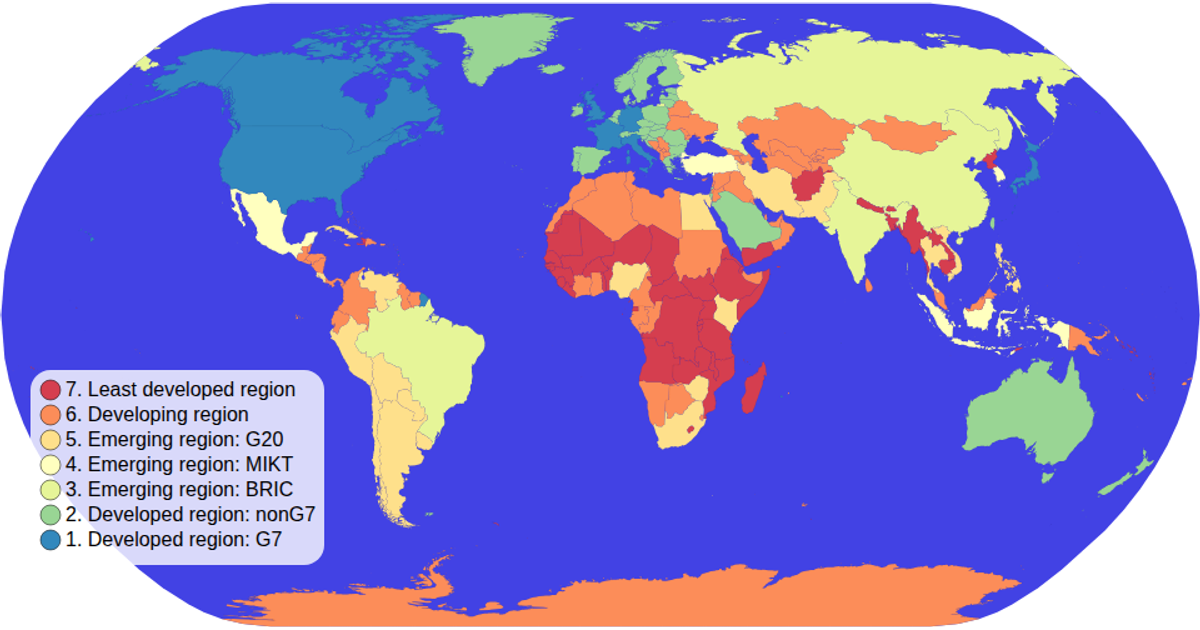
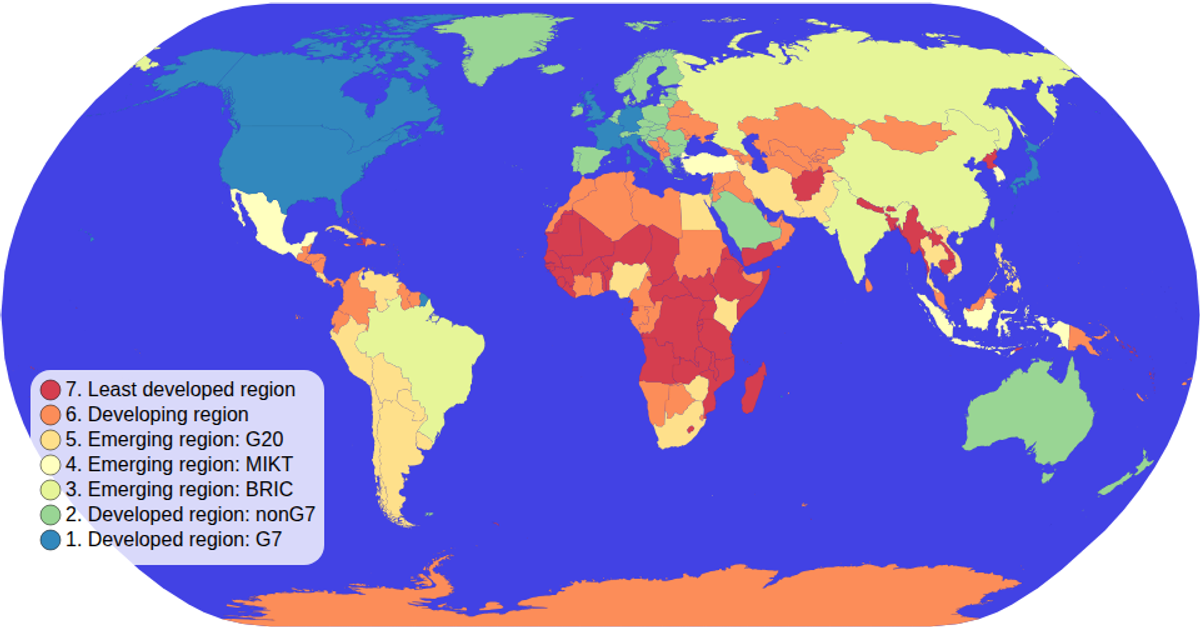
choropleth map - interactive filtering (Fork of dataviz 2018 #21)
Zzach b.
Last edited Aug 25, 2026
Created on Aug 25, 2026
This interactive choropleth map visualizes countries colored by economic grouping using an ordinal color scale. Users can click a legend swatch to highlight matching countries, dimming others, or click the map background to clear the filter. The visualization is built with D3 v5, using `geoNaturalEarth1` and `geoPath` for map projections and `scaleOrdinal` for colors. Data comes from the world-atlas TopoJSON and TSV files, with rendering in SVG.
AI-generated descriptionMIT Licensed




Comments
Sign in to join the discussion.