🌍 Public
Fork of Scatter Plot with Menus
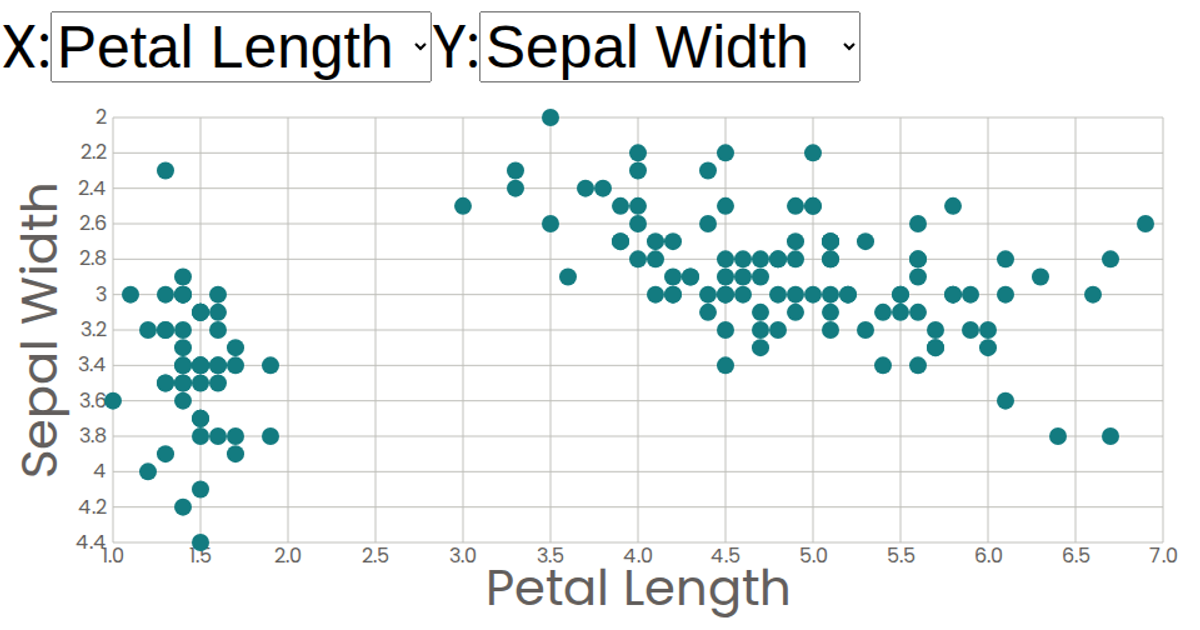
This interactive scatter plot visualizes the Iris dataset, displaying sepal and petal measurements as circles. Users can independently select which attribute appears on the X and Y axes from dropdown menus, with labels and scales updating dynamically. Built with React and D3 v5, the visualization uses `scaleLinear` for axes, `csv` for data loading, and SVG circles rendered through modular React components. The chart includes formatted axis ticks and tooltips showing values on hover.
AI-generated descriptionA scatter plot of The Iris Dataset.
MIT Licensed




Comments
Sign in to join the discussion.