CSAT3 Components Responsive Line Chart
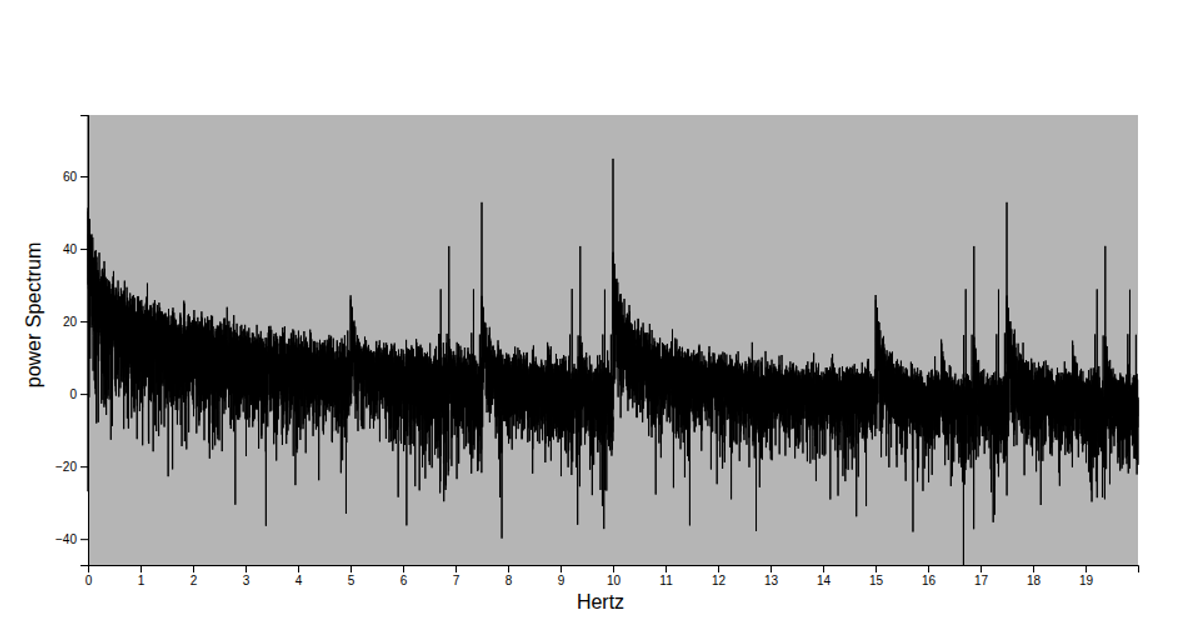
This responsive line chart visualizes the Uy_1 wind velocity component from a CSAT3 3-D sonic anemometer, plotting it against timestamps from the provided dataset. The visualization uses D3 scales and a line generator to draw the time series, with a gray inner rectangle framing the plotting area. It relies on `observeResize` from `@drbagwell/responsive-viz-axes` to adapt dimensions, while the `axes` module handles labeled axes for time and wind speed. The data file is imported from `@drbagwell/csat3-data-file`.
AI-generated descriptionOverview The CSAT3A 3-D Sonic Anemometer is the 3-D sonic anemometer of choice for eddy-covariance measurements. It has an aerodynamic design, a 10 cm vertical measurement path, operates in a pulsed acoustic mode, and withstands exposure to harsh weather conditions. Three orthogonal wind components (ux, uy, uz) and the speed of sound (c) are measured and output



Comments
Sign in to join the discussion.