hmp155A Responsive Line Chart
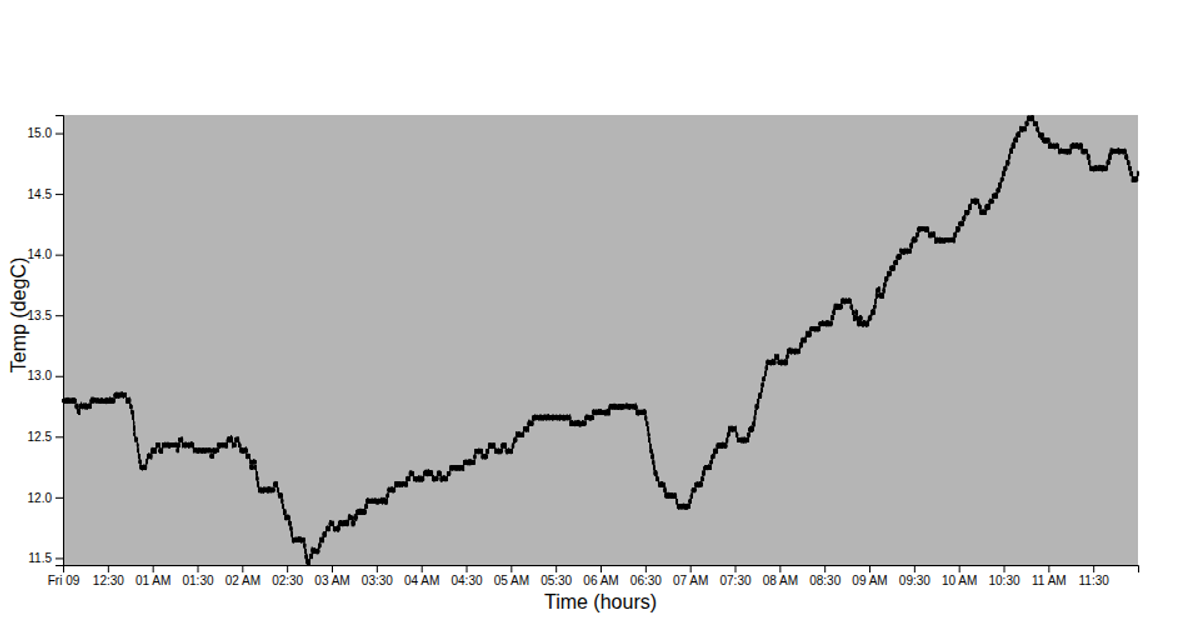
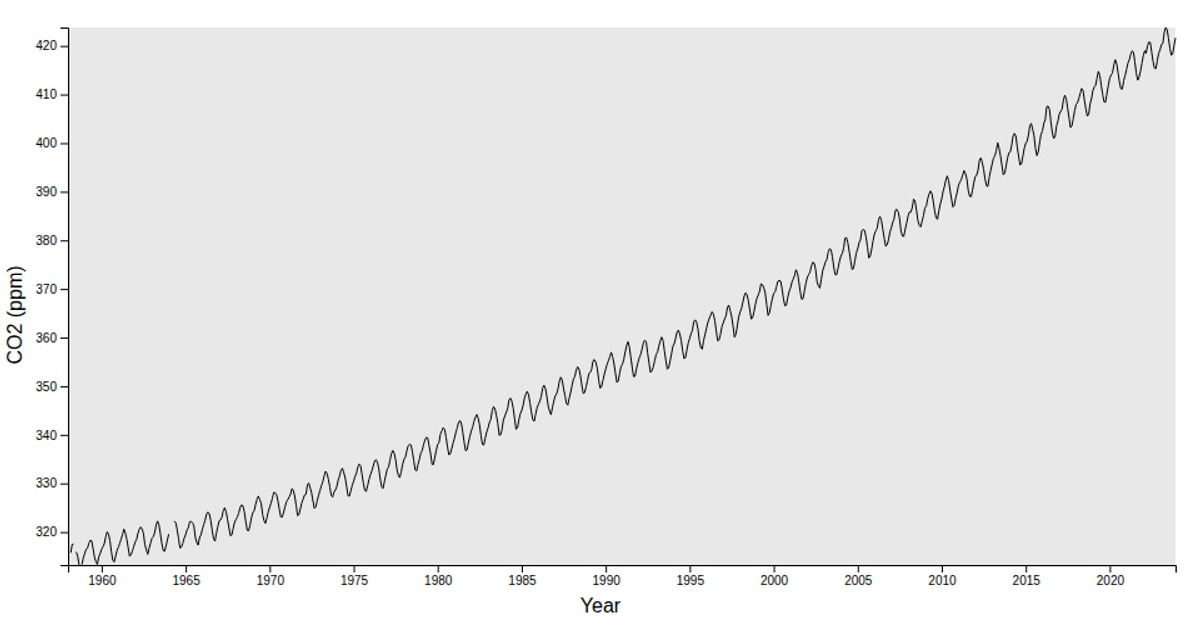
This responsive line chart visualizes temperature readings from the HMP155A probe, supplied via the `@drbagwell/stat-moving-averages` dataset. The chart plots temperature (degC) against time (hours), rendering data as a single black line over a grey inner rectangle, with labeled axes. Built with D3 v7, it uses `scaleTime` and `scaleLinear` for scaling, `line` for path generation, and the `observeResize` and `axes` functions from `@drbagwell/responsive-viz-axes` to dynamically recompute dimensions and redraw on container resizing.
AI-generated descriptionOverview The HMP155A provides reliable relative humidity (RH) and temperature measurements for a wide range of applications. It uses a HUMICAP®180R capacitive thin film polymer sensor to measure RH over the 0 to 100% RH range. A PRT measures temperature over the -80° to +60°C range. This rugged, accurate temperature/RH probe is manufactured by Vaisala.



Comments
Sign in to join the discussion.