🌍 Public
Graph Test
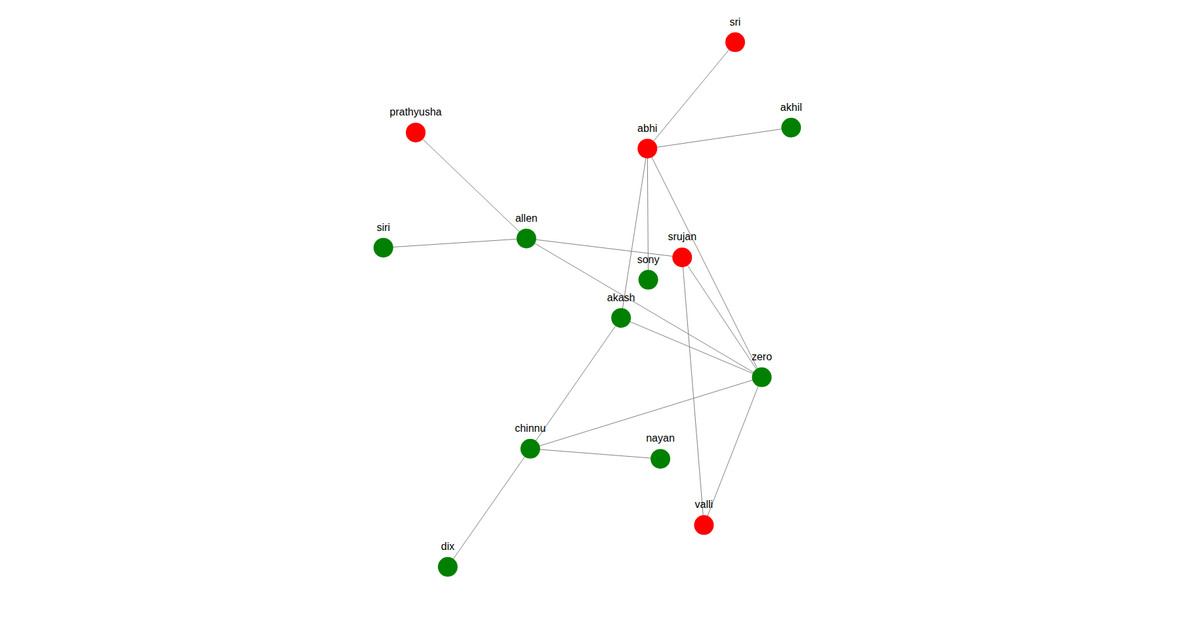
This graph diagram visualizes the network of connections within the Kenneth Rainin Foundation, representing predicates, referents, and groups as colored rectangular nodes. The visualization uses D3.js v6 with `forceSimulation` to position nodes, `forceManyBody` for repulsion, `forceLink` for edge constraints, and `forceCenter` for layout anchoring. Nodes are rendered as SVG rectangles with drag interactions, while links appear as lines between connected elements. The data is defined programmatically in data.js, with a custom color palette generated via Paletton.
AI-generated descriptionA graph diagram representing the network of connections of the Kenneth Rainin Foundation.
MIT Licensed



Comments
Sign in to join the discussion.