🌍 Public
Fork of Pie Chart
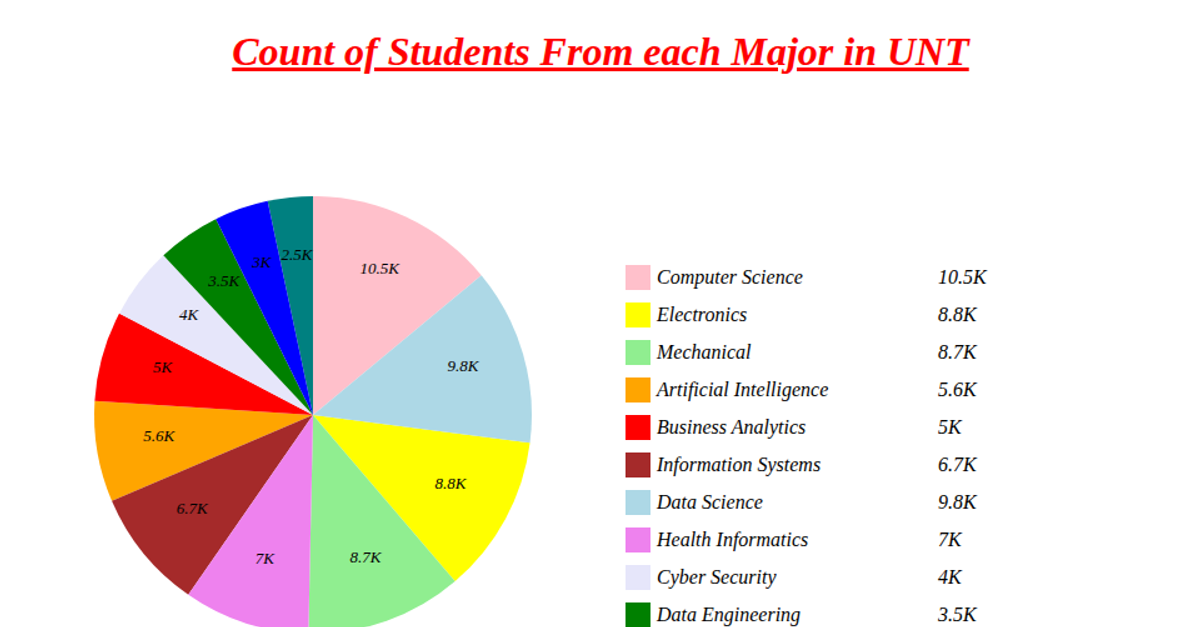
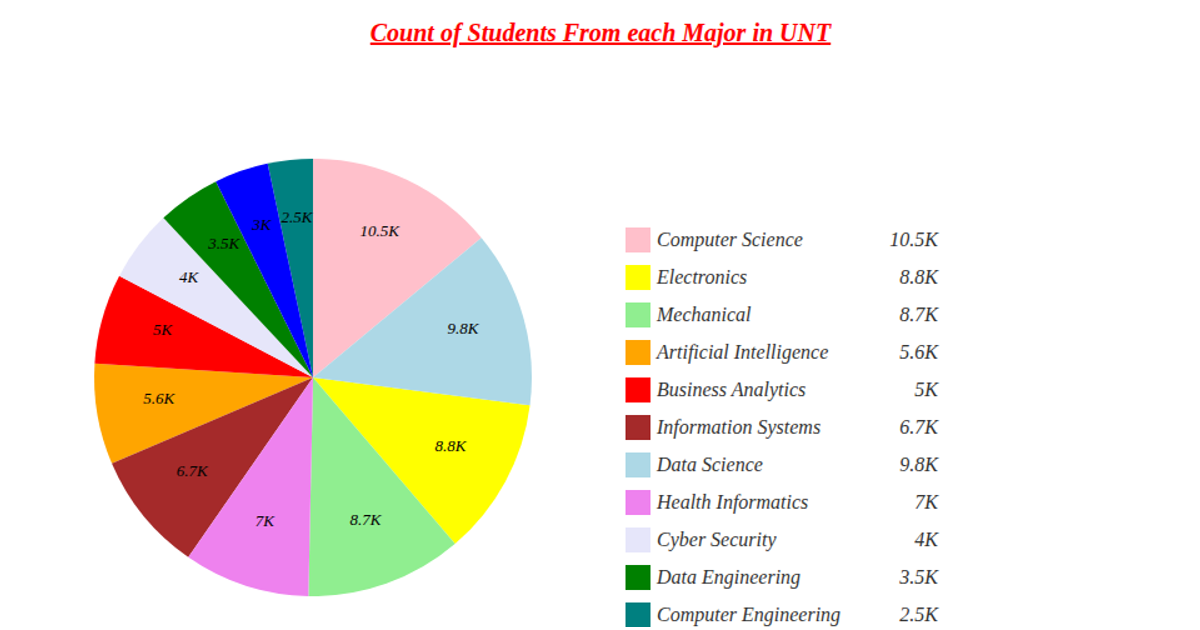
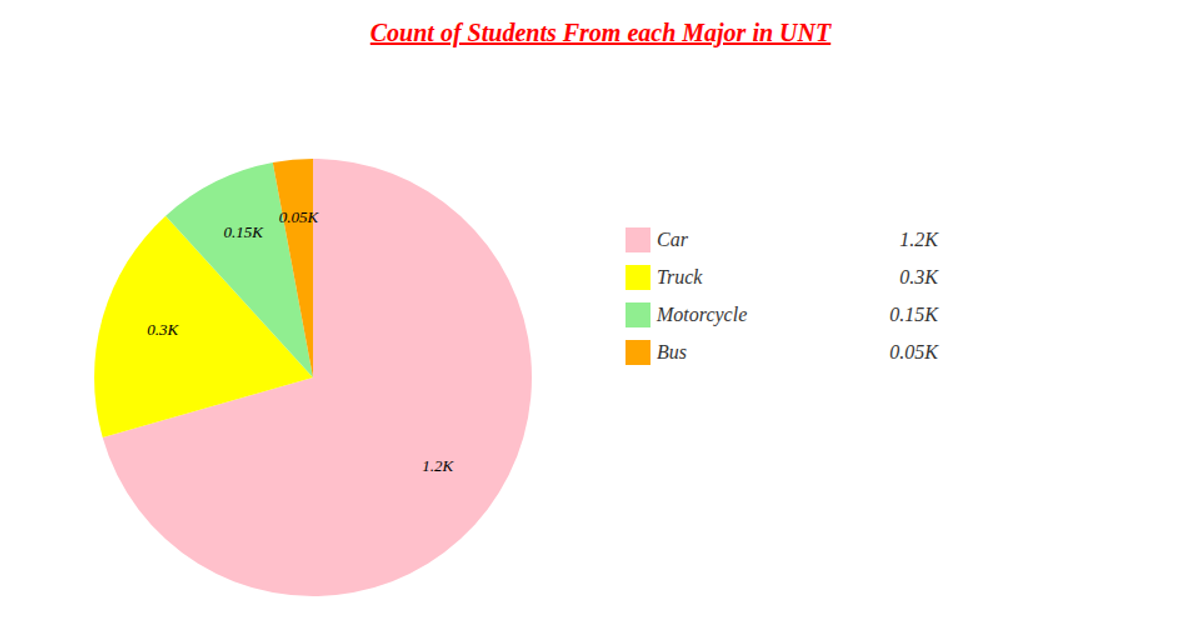
A donut chart depicts student counts by major at UNT, using data fetched from a remote CSV via `d3.csv`. The visualization employs `d3.pie` and `d3.arc` to generate the ring segments, with `d3.scaleOrdinal` assigning colors from a predefined array, and labels formatted using `d3.format`. A legend, positioned via SVG grouping, clarifies each major and its corresponding value. The chart is rendered as an SVG element, with styling defined in the accompanying CSS file.
AI-generated descriptionA demonstration of Pie chart.
MIT Licensed



Comments
Sign in to join the discussion.