🌍 Public
Fork of Pie Chart
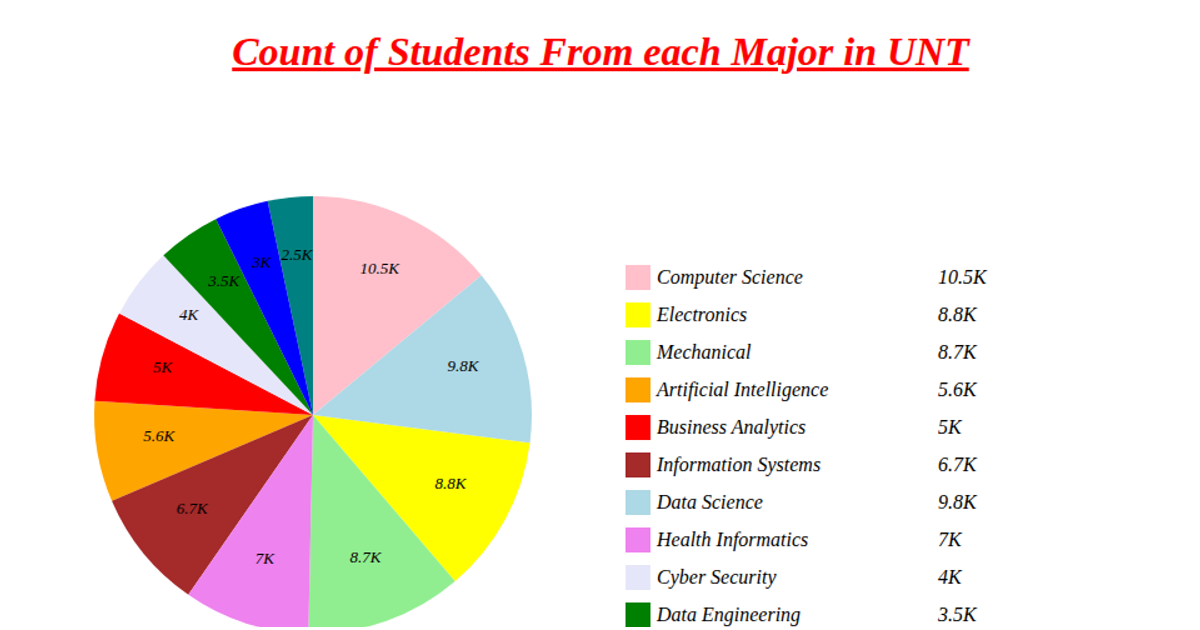
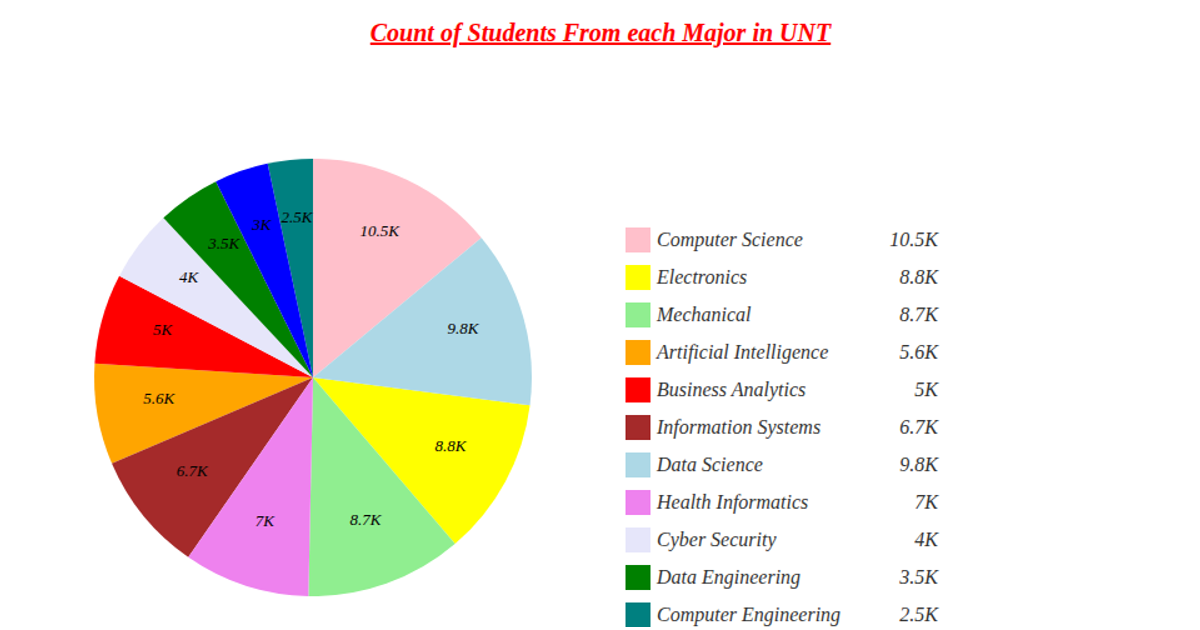
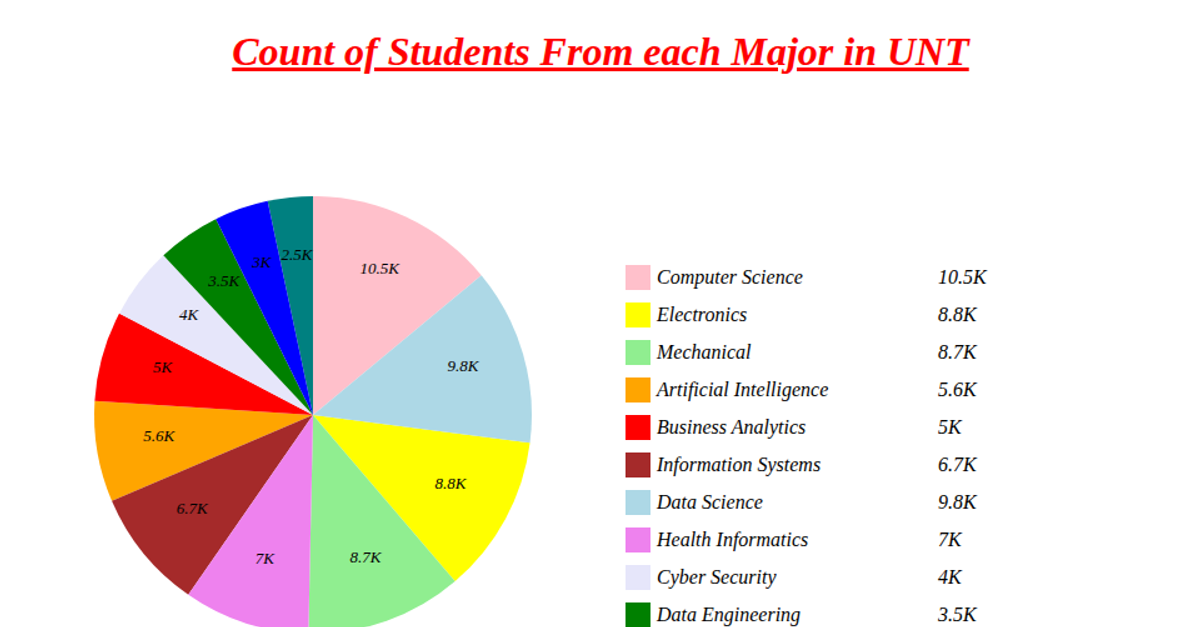
This pie chart shows the count of students from each major at UNT, with each segment labeled with the corresponding value in thousands. The chart is rendered as an SVG using D3 v5, with data loaded asynchronously via `d3.csv` from a GitHub Gist. Slice positions are computed with `d3.pie` and drawn using `d3.arc`, while a legend lists each major alongside its student count. Colors are assigned via `d3.scaleOrdinal`, and values are formatted with `d3.format`.
AI-generated descriptionMIT Licensed




Comments
Sign in to join the discussion.