🌍 Public
lohiact6_Task3.1
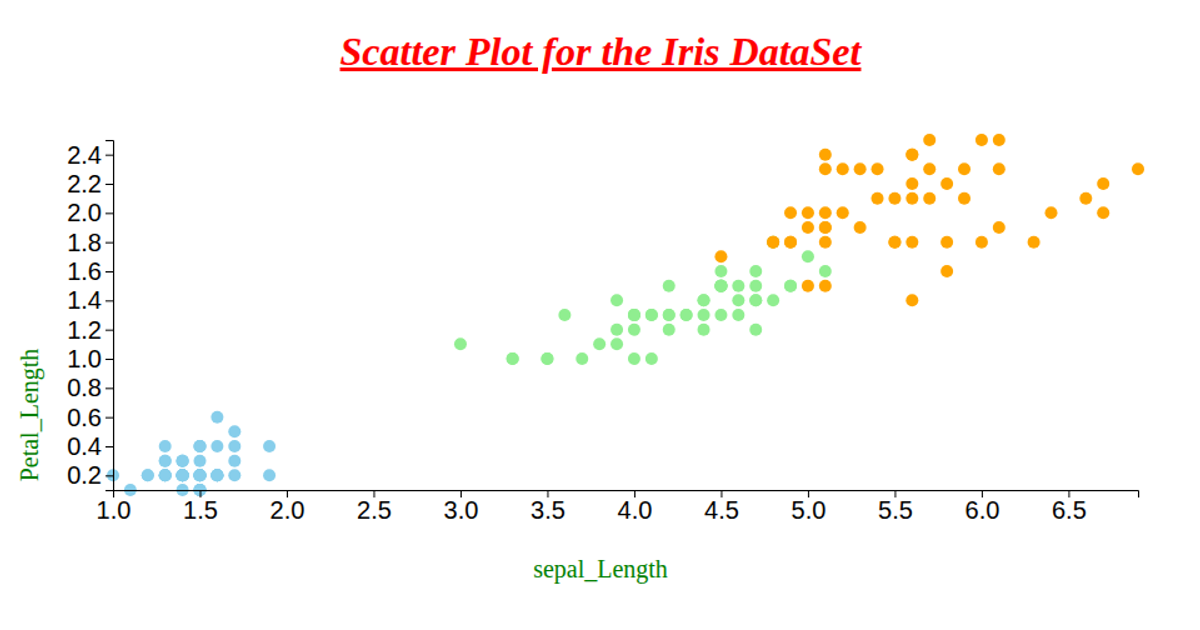
A scatter plot shows the relationship between petal length and petal width for synthetic flower specimens, with each circle colored by species using a d3.scaleOrdinal mapping to skyblue, lightgreen, and orange. The visualization loads tab-separated CSV data via d3.dsv, converts numeric fields, and renders axes with d3.axisBottom and d3.axisLeft. Circles are positioned using d3.scaleLinear scales and appended as SVG elements with opacity set for readability. The code uses D3 v6 to bind data and draw the chart within an SVG container.
AI-generated descriptionMIT Licensed




Comments
Sign in to join the discussion.