🌍 Public
ICE 7-Q3 Ajay Polsani
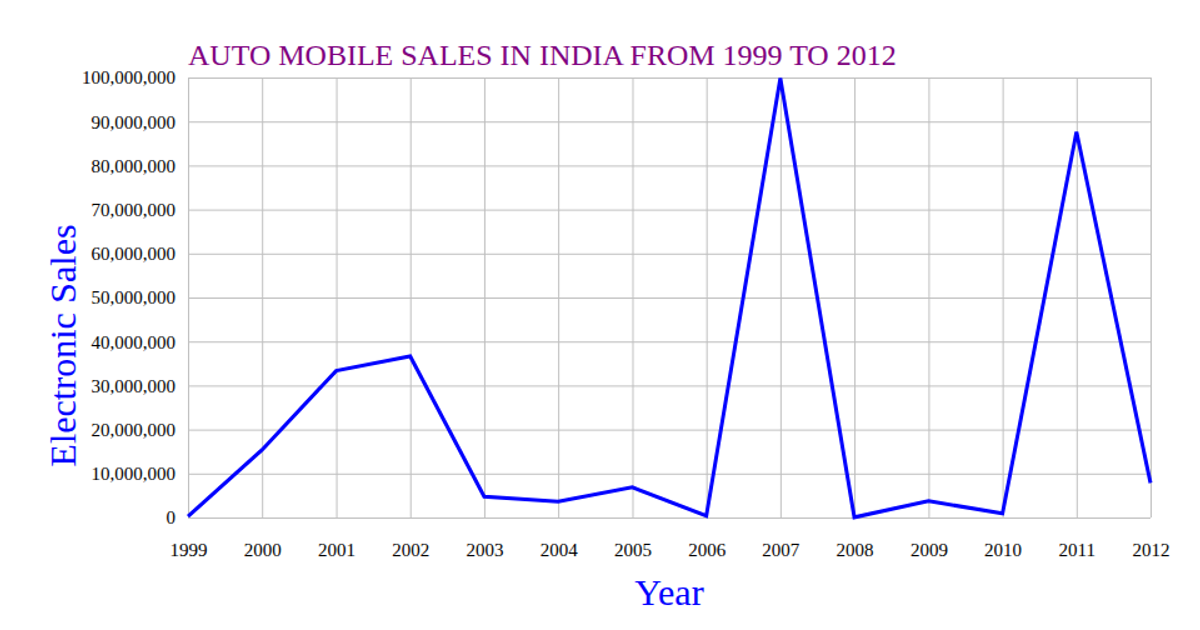
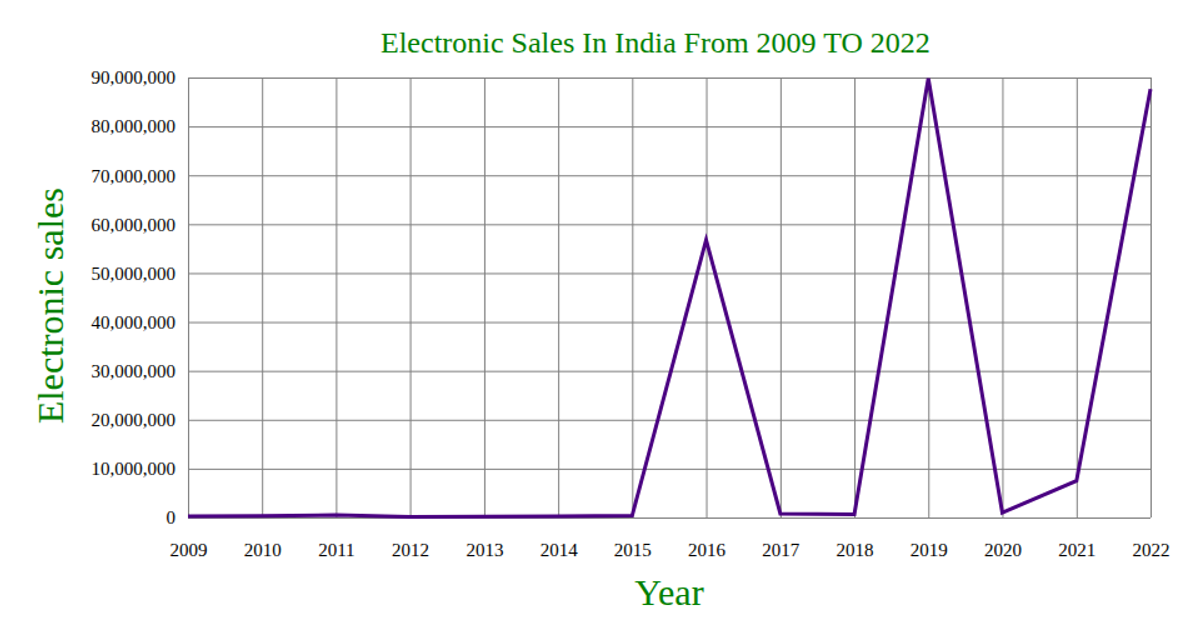
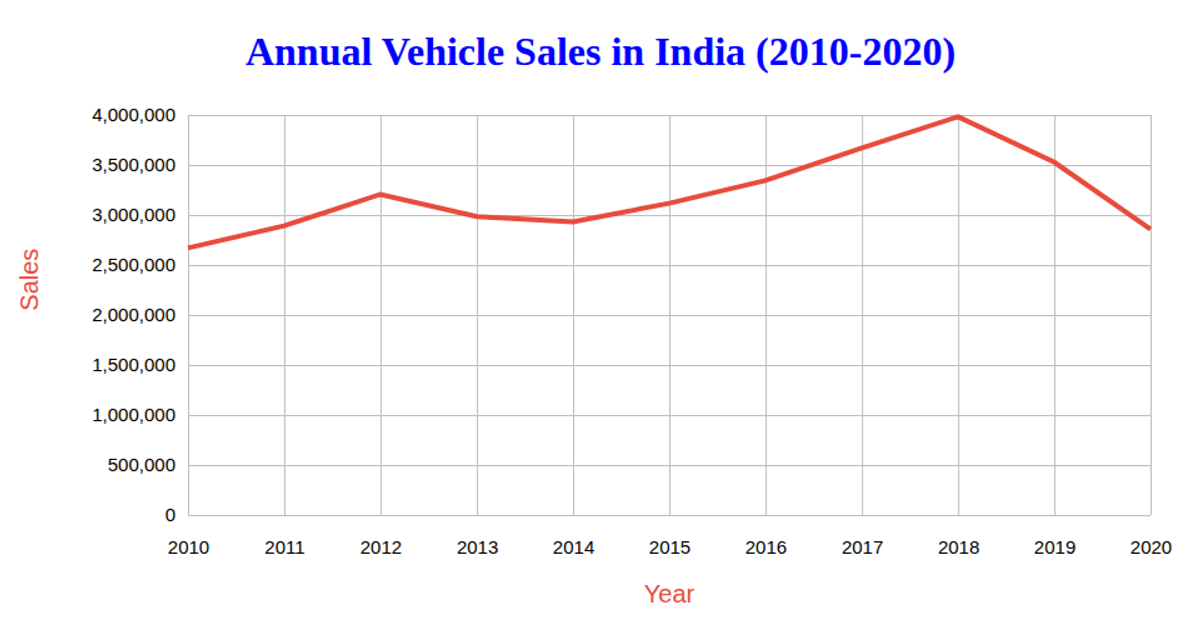
This visualization displays bike sales in India from 2009 to 2019 using a line chart rendered with React and D3 v7. The line chart plots years on the x-axis using d3.scaleTime and sales numbers on the y-axis using d3.scaleLinear, with data loaded from a CSV file via d3.csv. The rendered SVG includes custom axes, a smoothed curve created with d3.line and curveBasis, and axis labels showing "Year" and "Number of Sales."
AI-generated descriptionMIT Licensed




Comments
Sign in to join the discussion.