🌍 Public
ICE - Eight 1B - Madagascar Map
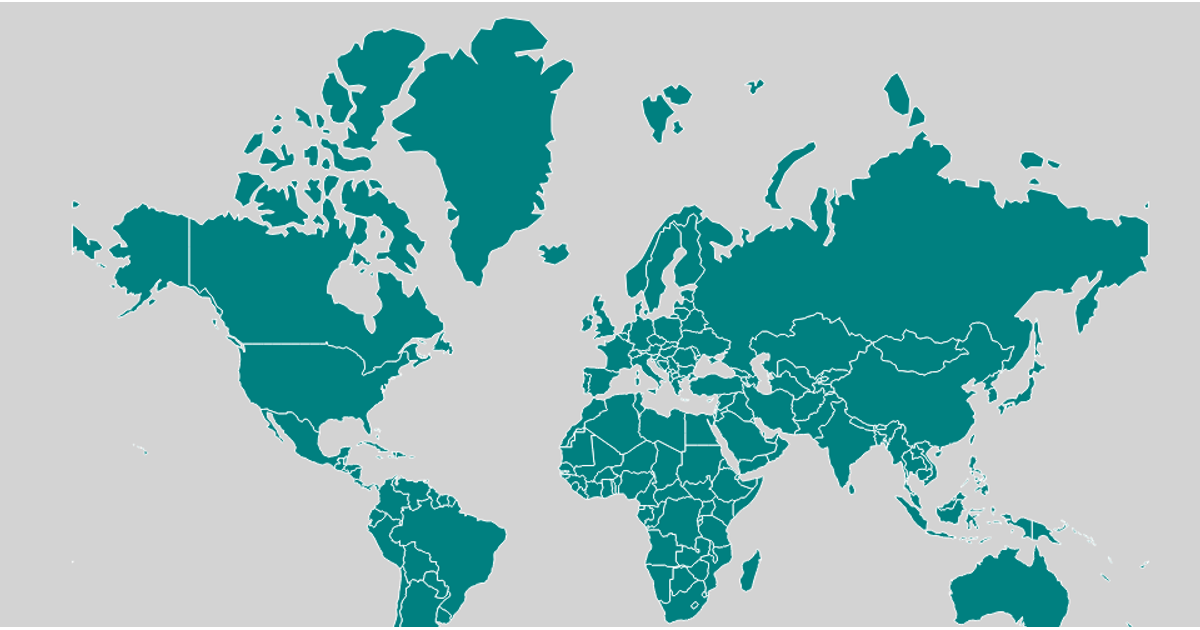
This example displays a choropleth-style map of Madagascar, with the country’s boundary rendered in orange and its interior filled with light green. The map highlights regions on hover by turning them yellow. Built with D3 v7 and TopoJSON, it loads world-atlas country data, filters to Madagascar, and projects the geometry using `d3.geoMercator` with `fitSize`. Paths are generated via `d3.geoPath` and rendered as SVG, with mouse events changing fill colors.
AI-generated descriptionA bare minimum HTML page demonstrating use of CSS and JavaScript.
See also React Starter.
MIT Licensed


Comments
Sign in to join the discussion.