🌍 Public
ICE 8 - World Map
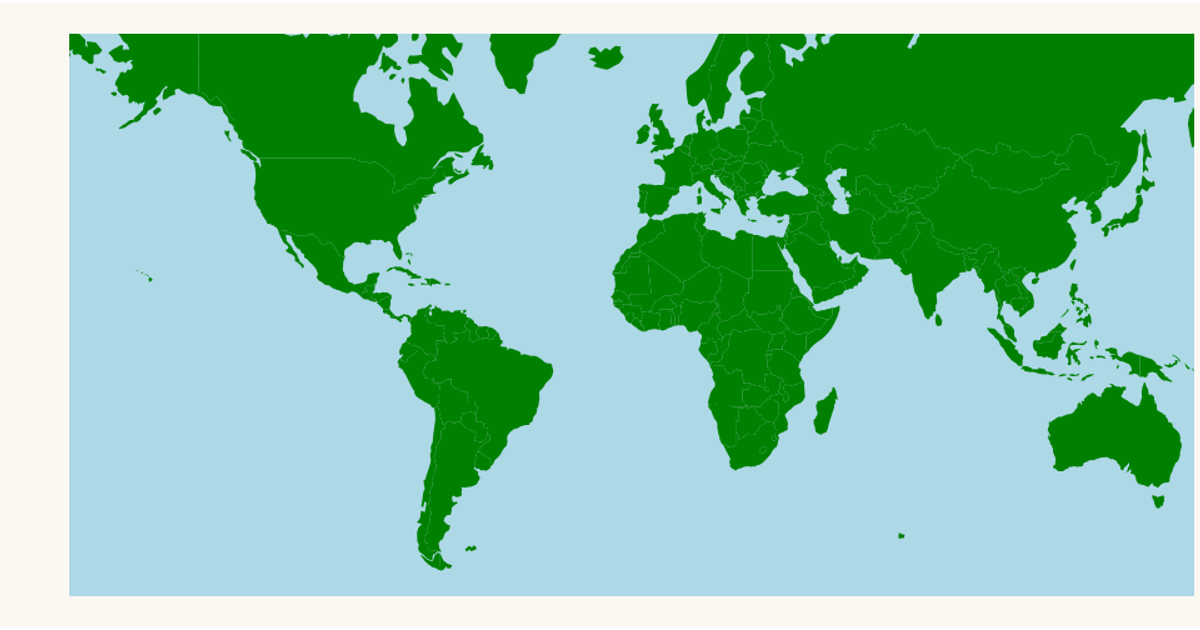
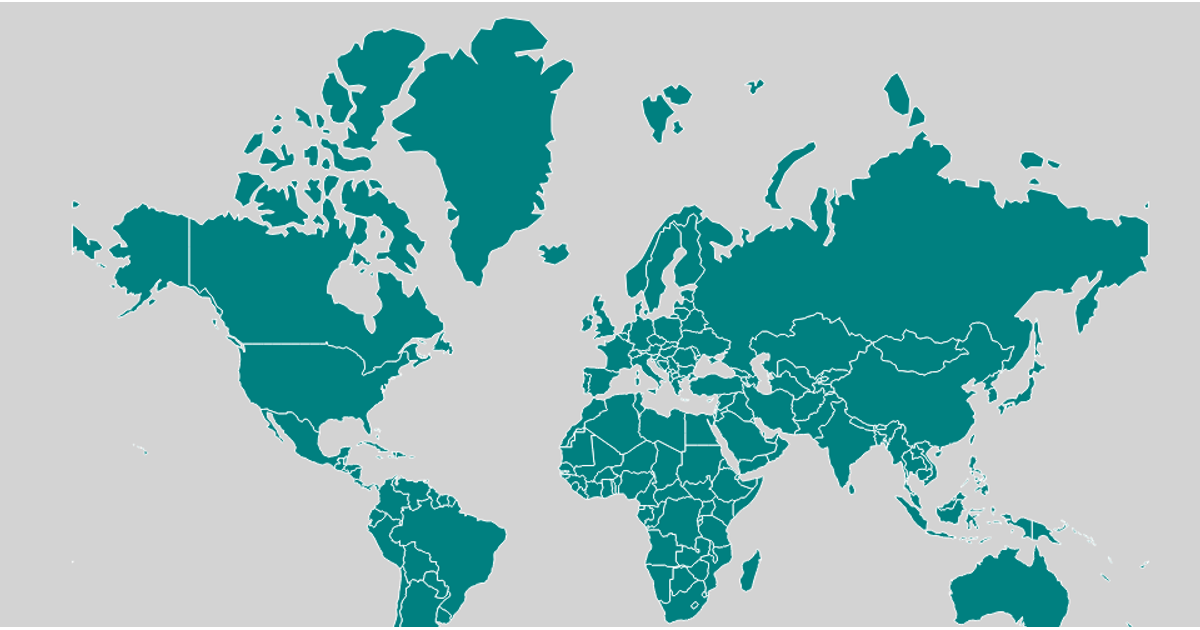
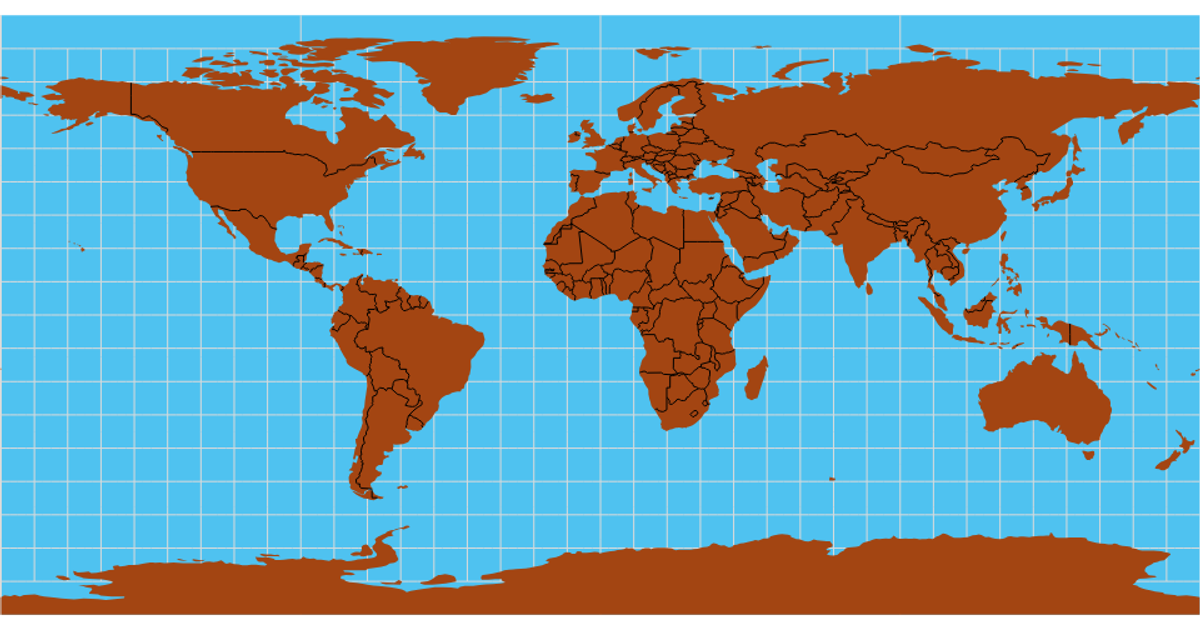
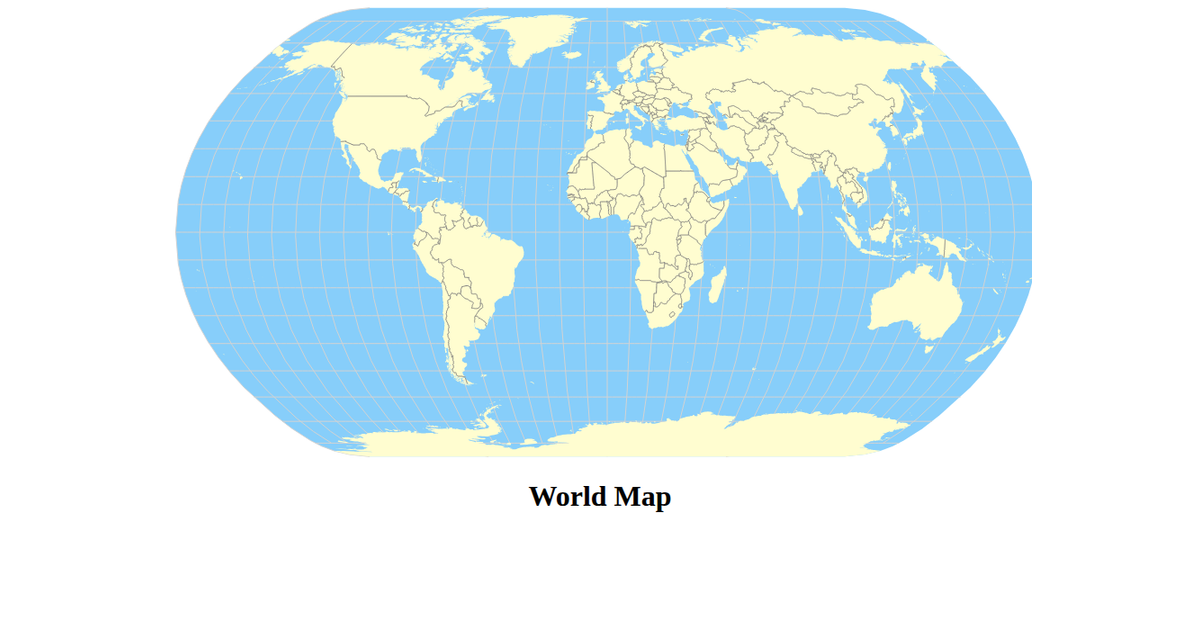
This example displays a world map rendered as purple countries against a black background using a Mercator projection. The visualization loads geographic data from the world-atlas TopoJSON file, converts it to GeoJSON with topojson-client, and draws the map using D3’s d3.geoPath. The SVG output is styled with CSS for centered placement and black backgrounds, demonstrating a straightforward approach to geographic data visualization in a React context.
AI-generated descriptionA bare minimum HTML page demonstrating use of CSS and JavaScript.
See also React Starter.
MIT Licensed



Comments
Sign in to join the discussion.