🌍 Public
WorldMap Simple
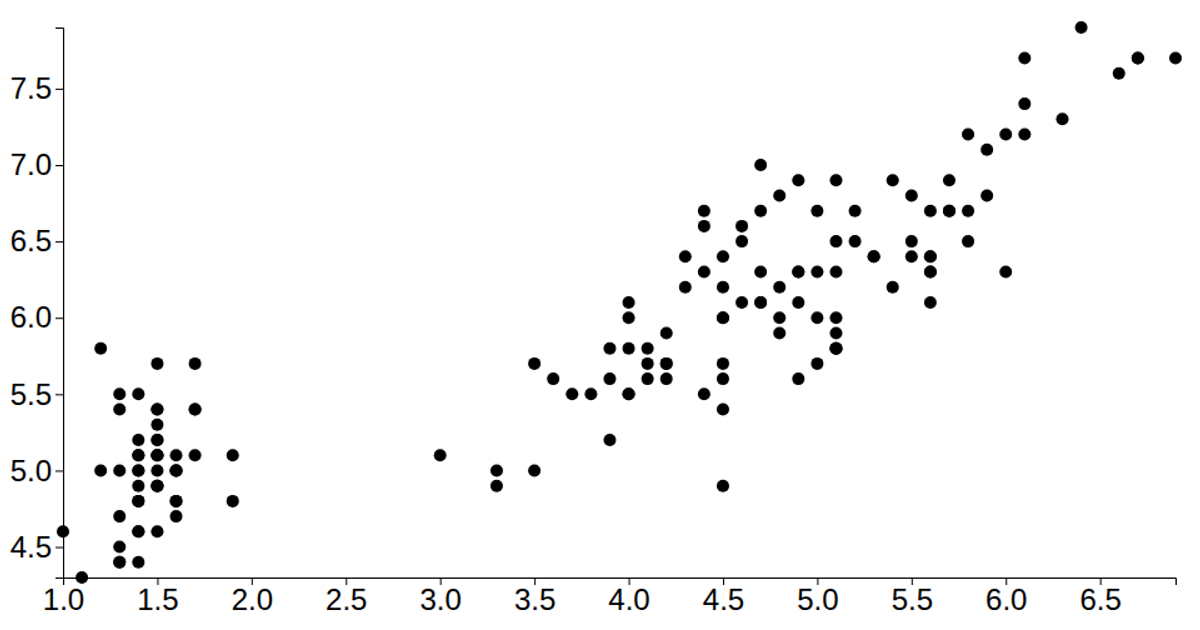
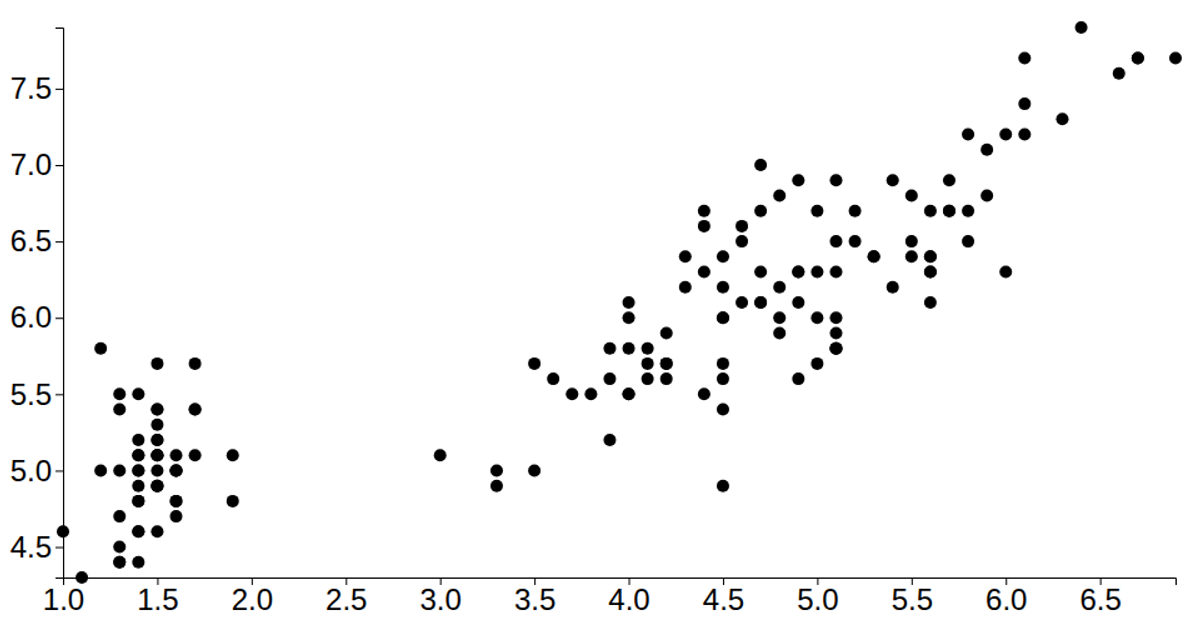
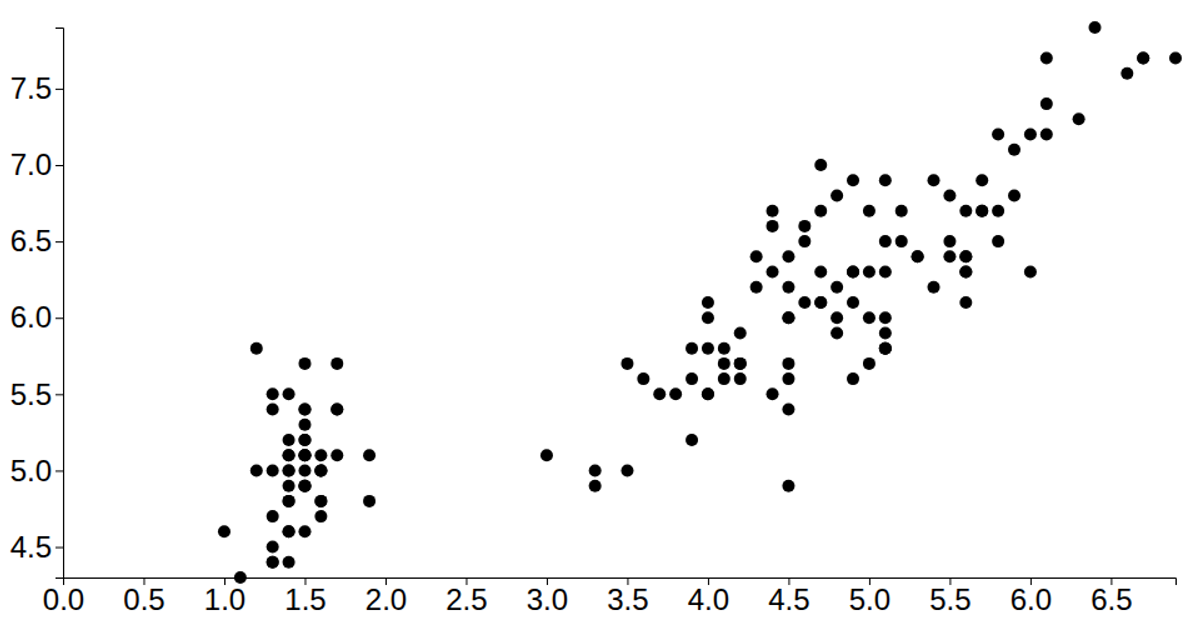
This example visualizes the classic Iris dataset as a scatter plot, mapping petal length on the x-axis and sepal length on the y-axis. It renders circular marks for each observation using D3 v6’s `csv` loader, `scaleLinear`, and `axisLeft`/`axisBottom` for the axes. The plot fills the entire browser window, leveraging SVG circles with a fixed radius. Data is fetched from a GitHub Gist containing the Iris CSV file, which is parsed with custom number coercion for its four numeric columns.
AI-generated descriptionMIT Licensed



Comments
Sign in to join the discussion.