🌍 Public
D3 Scatter Plot
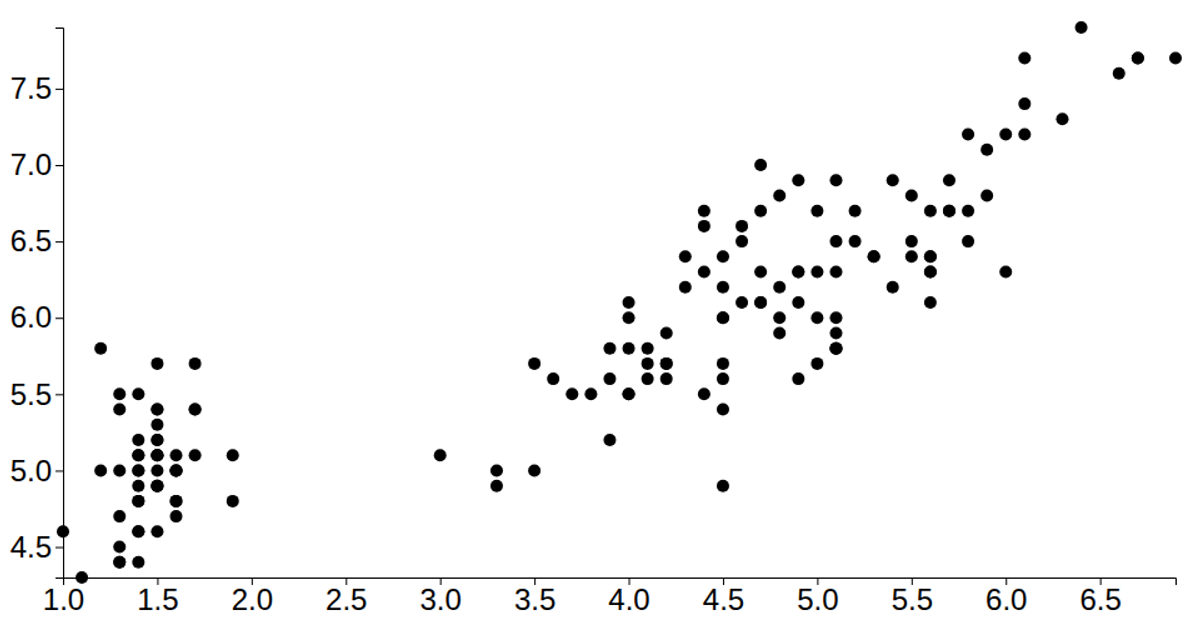
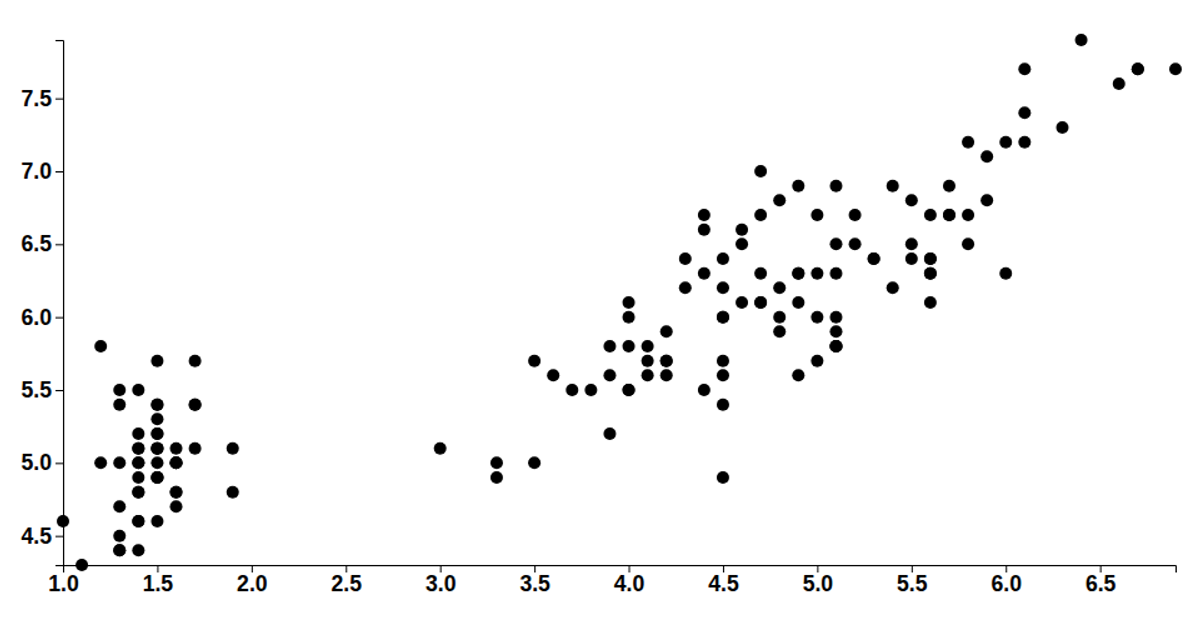
This example displays the classic Iris dataset as an interactive scatter plot, mapping petal length on the x-axis and sepal length on the y-axis to reveal patterns across the flower samples. The visualization uses D3 v6’s `scaleLinear`, `axisLeft`, and `axisBottom` APIs to construct axes and render circles in SVG, with data loaded asynchronously via `d3.csv` from a GitHub gist. The plot fills the entire browser window, using a simple margin-based layout and a fixed point radius to represent each data point.
AI-generated descriptionMIT Licensed


Comments
Sign in to join the discussion.