🌍 Public
Fork of Fork of Thai E
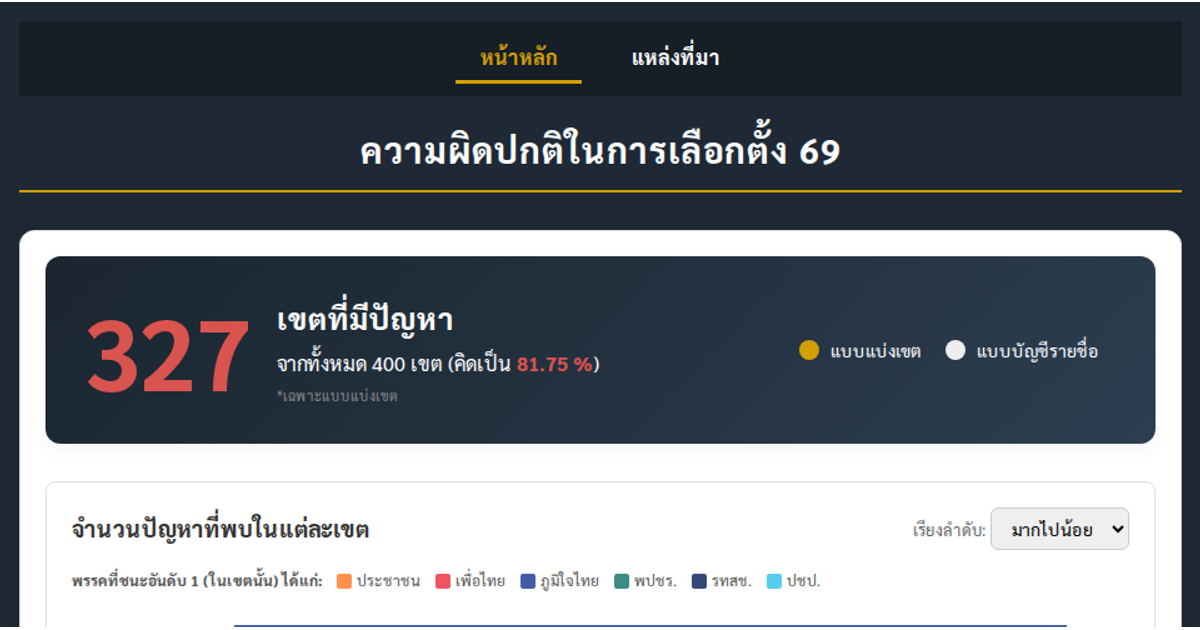
This dashboard visualizes anomalies in Thailand's 69th election, displaying a choropleth map, bar chart, pie chart, and scatter plot. Users can toggle between district and party-list views, filter by political party, and explore problem reports, invalid ballots, or voter turnout. D3.js v7 powers all SVG renderings with animated transitions. The scatter plot uses `d3.scaleLinear` for axes and includes a dashed trend line. Data originates from a CSV file with columns covering vote counts, win margins, and anomaly indicators.
AI-generated descriptionMIT Licensed




Comments
Sign in to join the discussion.