🌍 Public
khyathi assignment 6
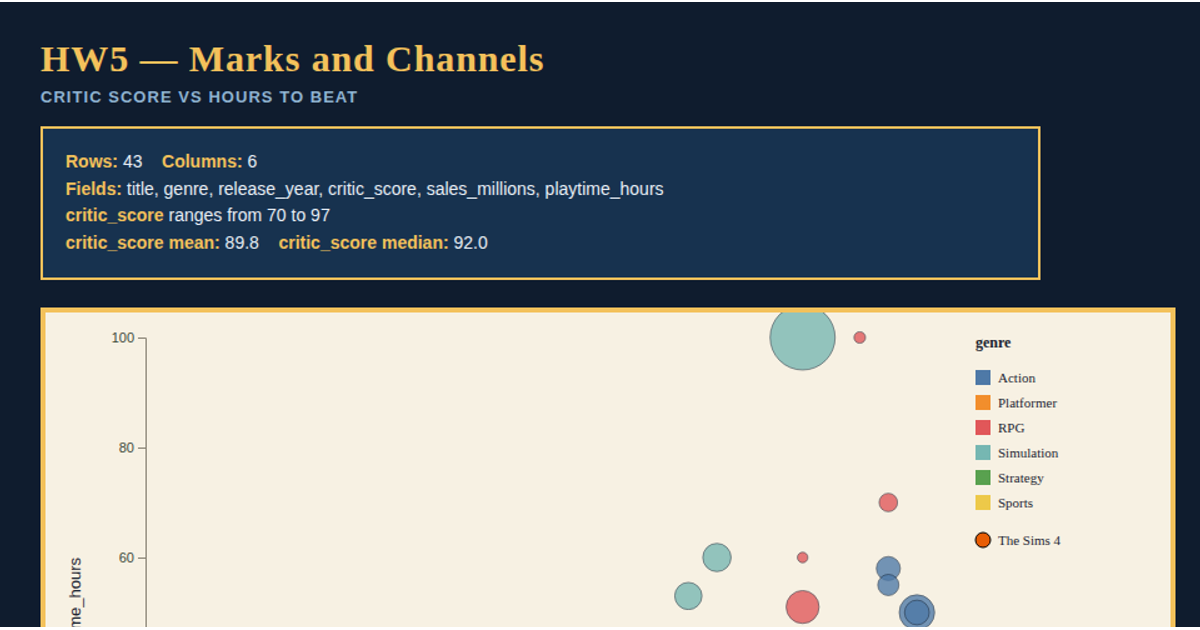
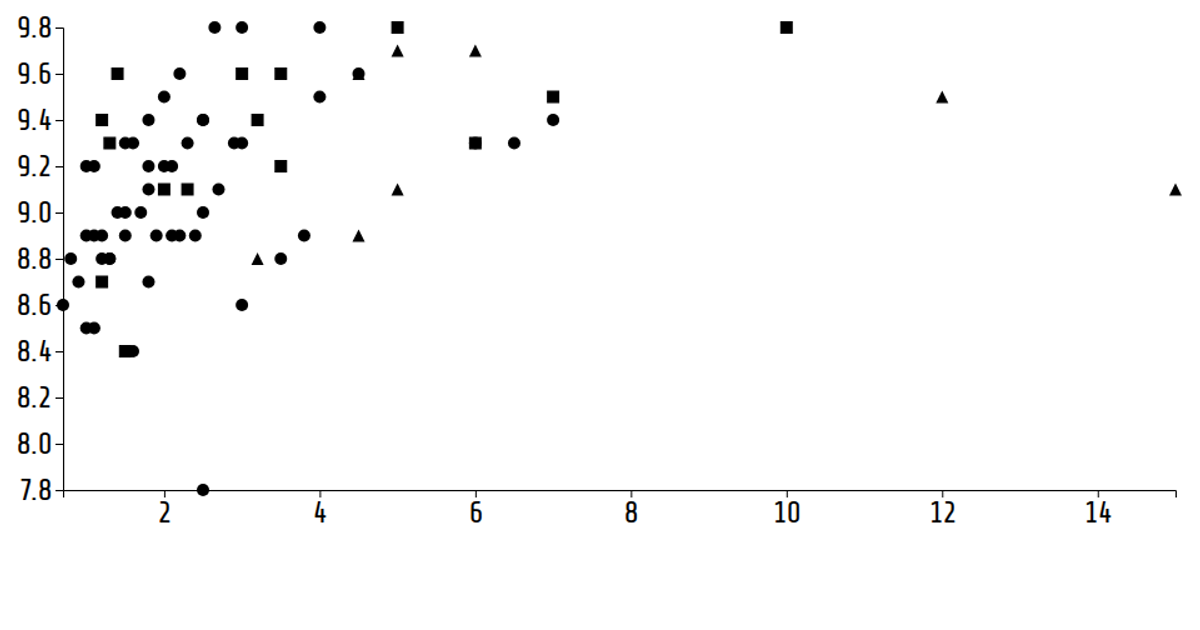
This interactive dashboard compares multiple visual encodings for a synthetic video-game dataset of 24 games across 6 years. A Plotly 3D scatter plot maps hours_played, rating, and sales_millions by genre, with buttons for preset angles and drag-to-rotate. D3 v7 renders a 2D bubble chart with circle area encoding sales, alongside small multiples faceted by year with shared scales. An animated panel provides play/pause controls and a ghost frame option, all rendered as SVG with selection highlighting and hover tooltips.
AI-generated descriptionMIT Licensed






Comments
Sign in to join the discussion.